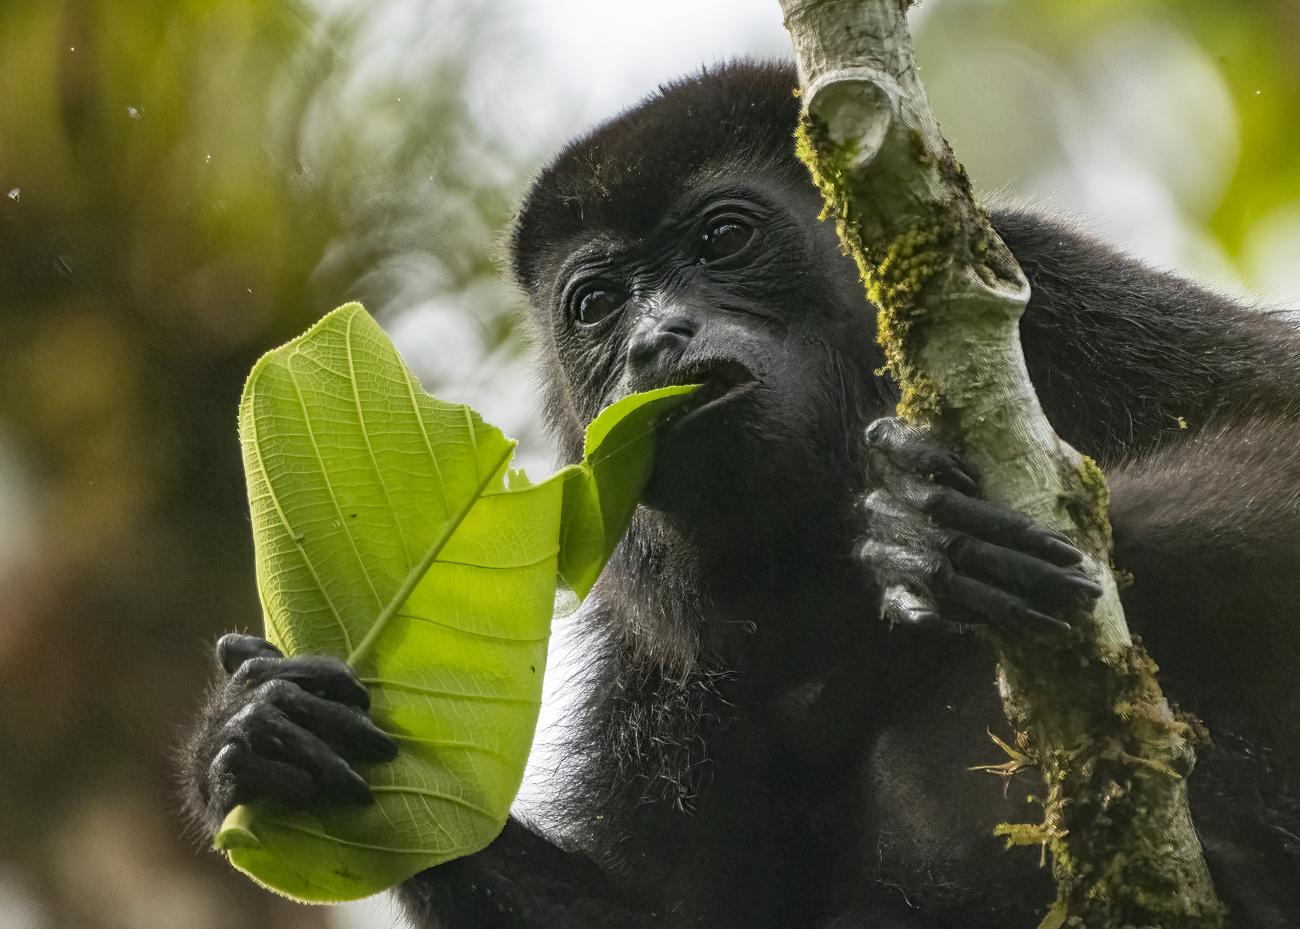
A potted scarlet monkeyflower can look fine one day and collapse a few days later if you forget to water it. But out in the wild, some populations of this same species made it through California’s brutal four-year drought.
The wildflowers…
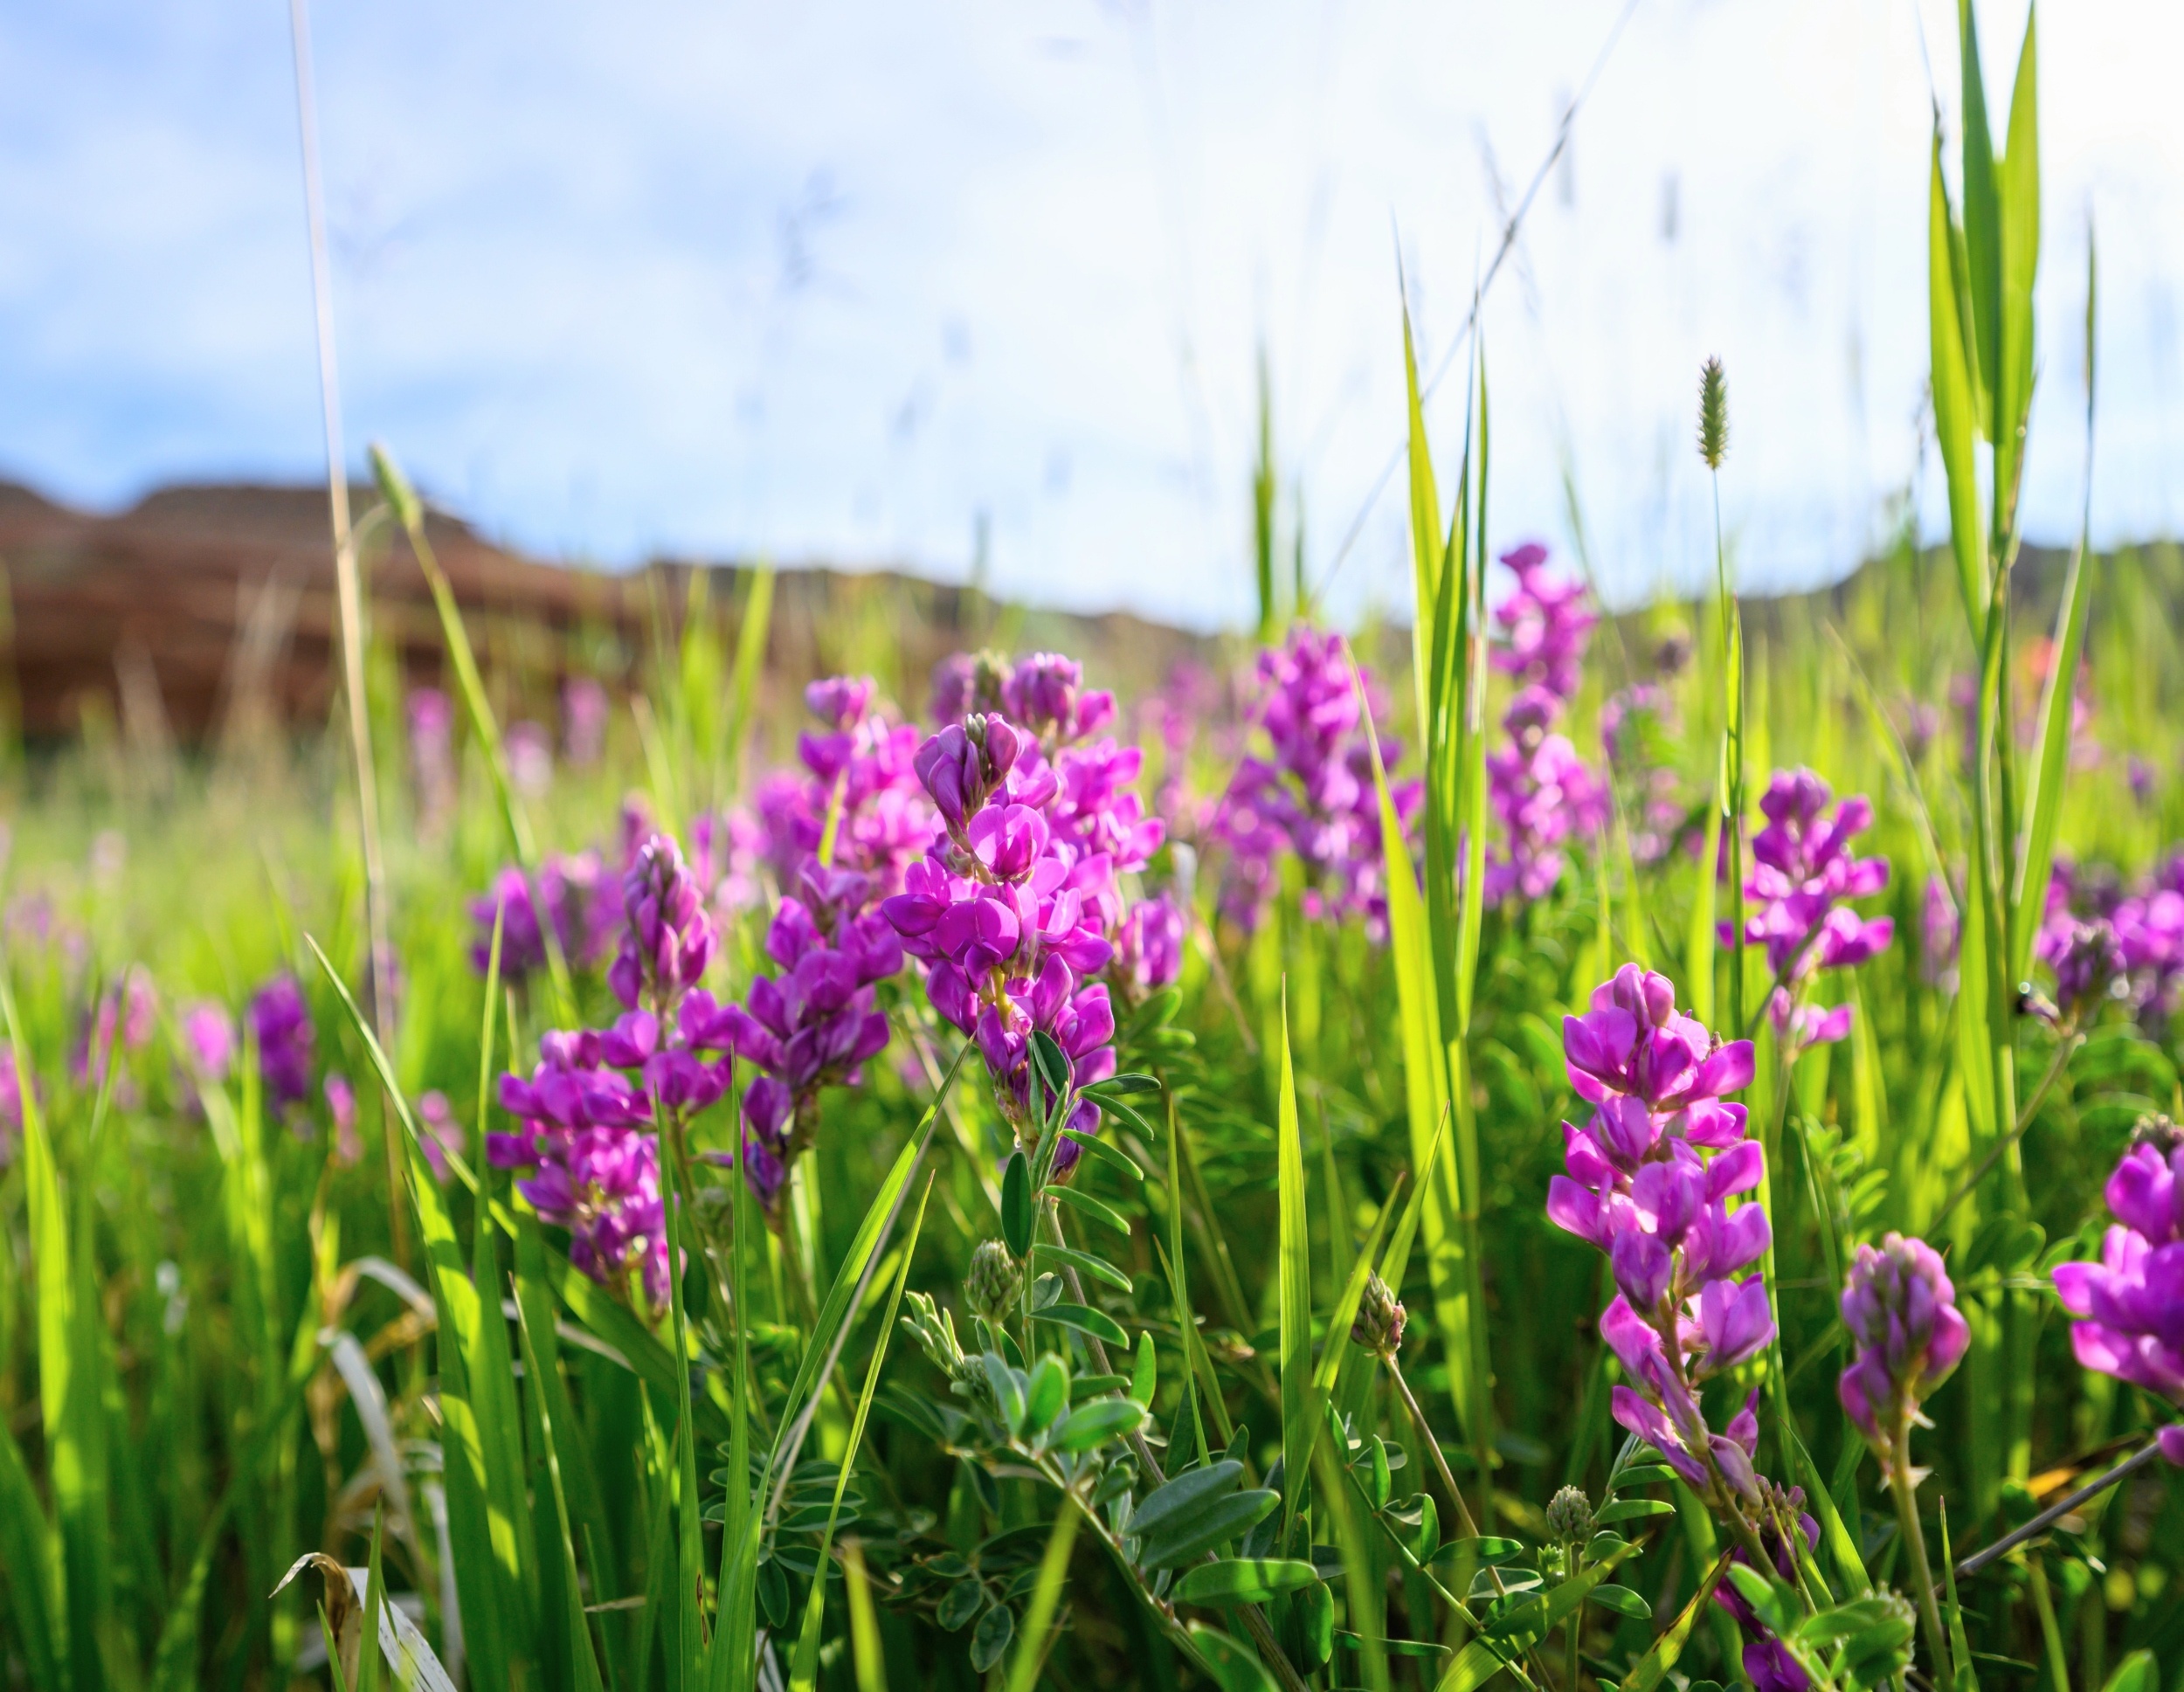
A potted scarlet monkeyflower can look fine one day and collapse a few days later if you forget to water it. But out in the wild, some populations of this same species made it through California’s brutal four-year drought.
The wildflowers…
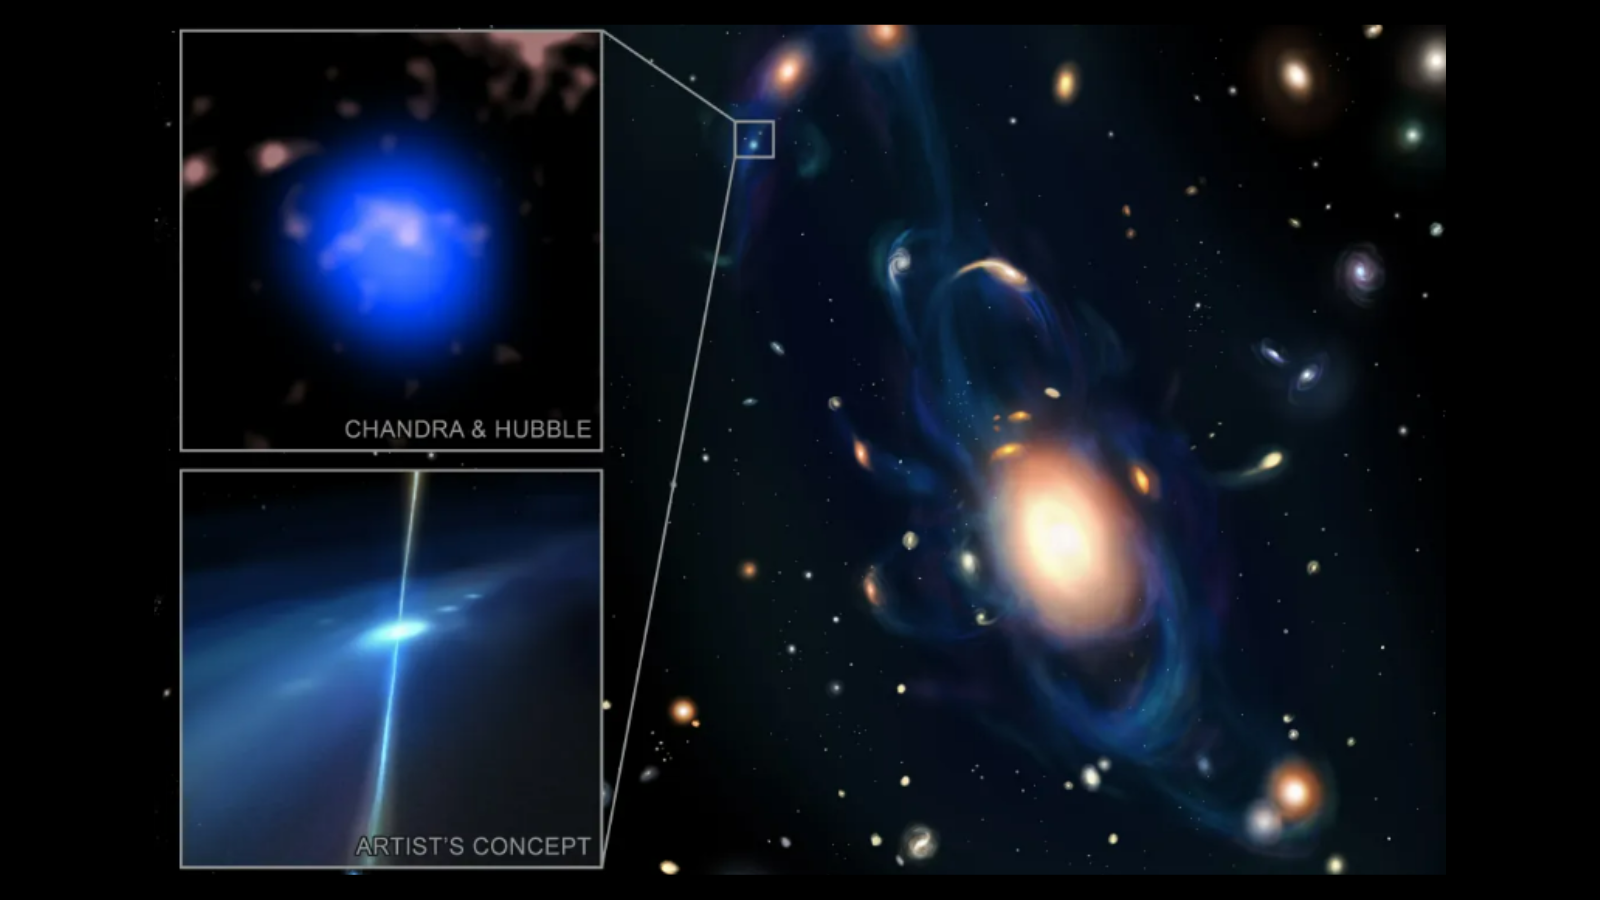
Astronomers have tracked a powerful blast of radiation called a gamma-ray burst (GRB) back to its source, finding a collision between extreme stellar remnants called neutron stars within colliding galaxies. This could reveal more about these…
Maize serves as a vital model species for advancing our understanding of plant biology, yet many mysteries remain about the intricate processes governing how DNA works and organizes itself in the genome.
A team of FSU researchers together…
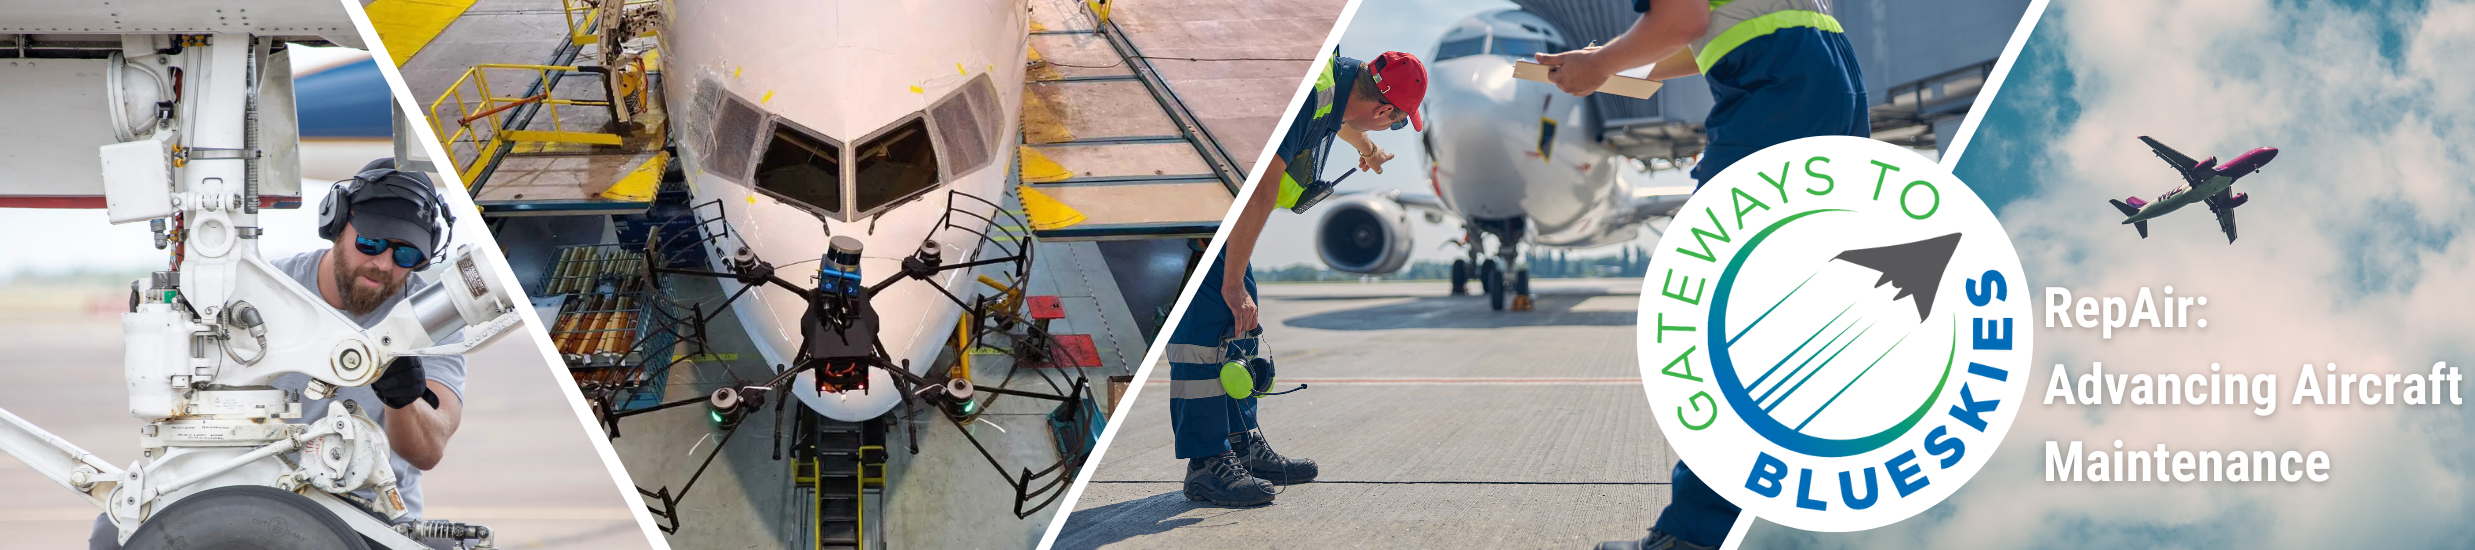
NASA has selected eight student teams as finalists in the 2026 Gateways to Blue Skies Competition, giving them the resources to help address a critical challenge for U.S. aviation: maintenance.
Challenges facing the commercial…
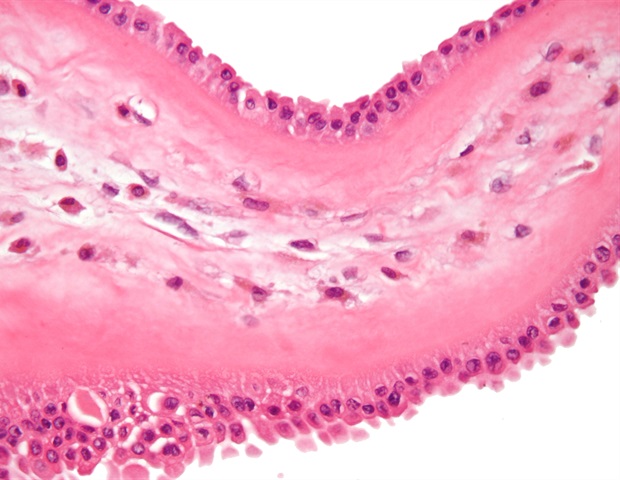
Macrophages are central to mechanobiology research: their physical characteristics-stiffness, adhesion, and ECM (extracellular matrix) sensing-are inextricably linked to their phenotypic polarization and immune function….
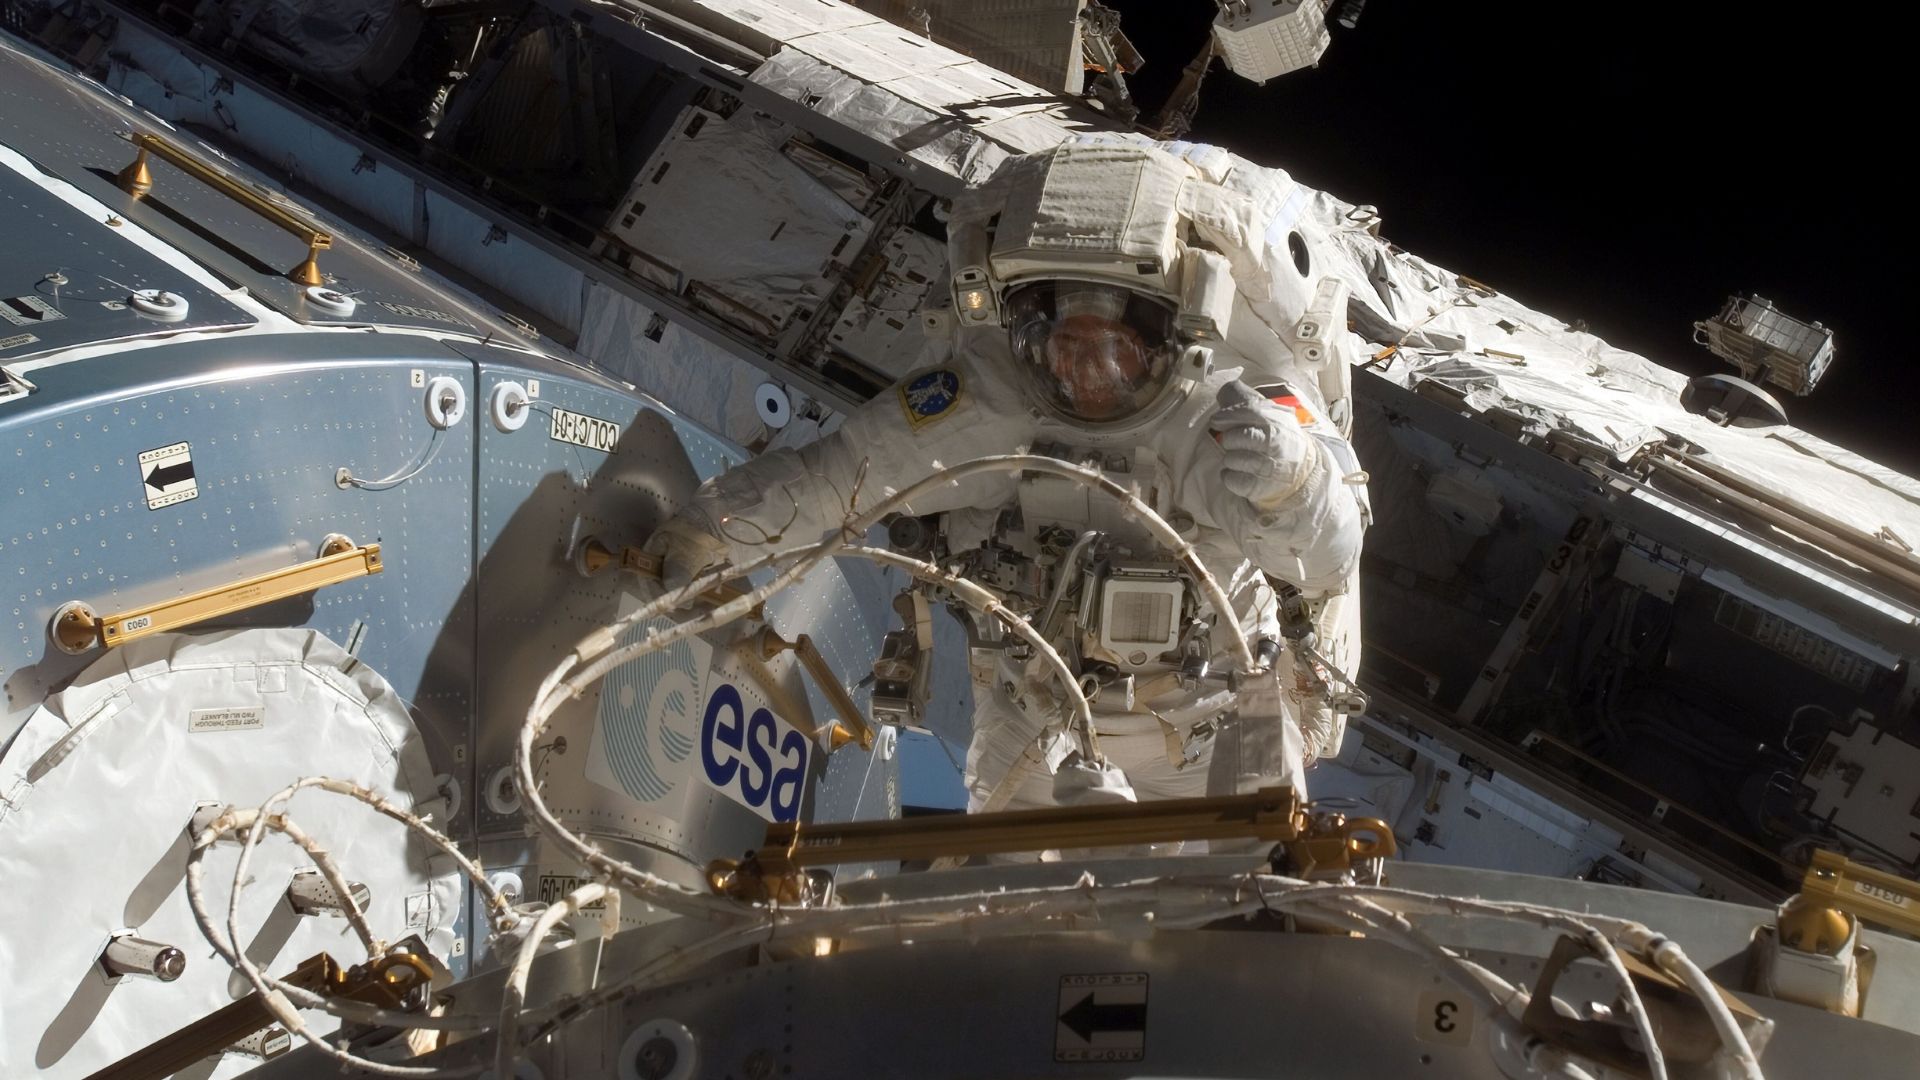
Scientists have developed Europe’s first simulator capable of recreating galactic cosmic rays, one of the most dangerous radiation threats in deep-space travel.
An international research team built the system with support from the European…

Scientists in Sweden and the U.S. today reported the first-ever direct observation a type of short‑lived molecule that has shaped decades of thinking in atmospheric chemistry, combustion research and biomedical science.
Publishing in…

A cargo resupply spacecraft is on its way back to Earth from the International Space Station, where it’s expected to make a fiery reentry this weekend into the planet’s atmosphere.
Northrop Grumman’s uncrewed Cygnus XL spacecraft, which reached