Qaasid News
Download Our App
Latest News from Pakistan
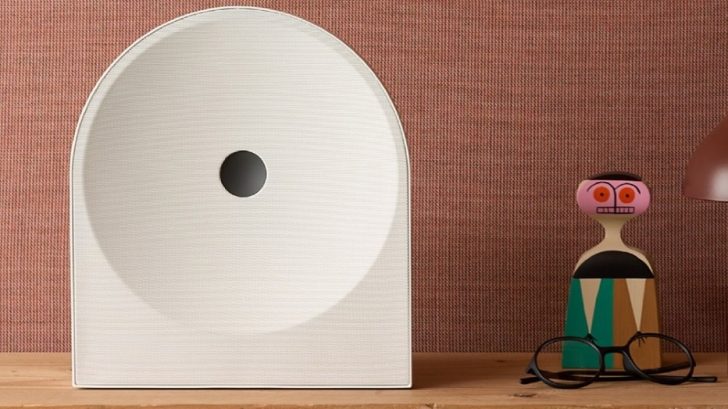
Samsung Expands Its Audio Ecosystem for 2026 with Smarter Multi-Device Sound and Immersive New Designs – Samsung Newsroom Australia
December 30, 2025
Expert warns of surge in super flu
December 30, 2025
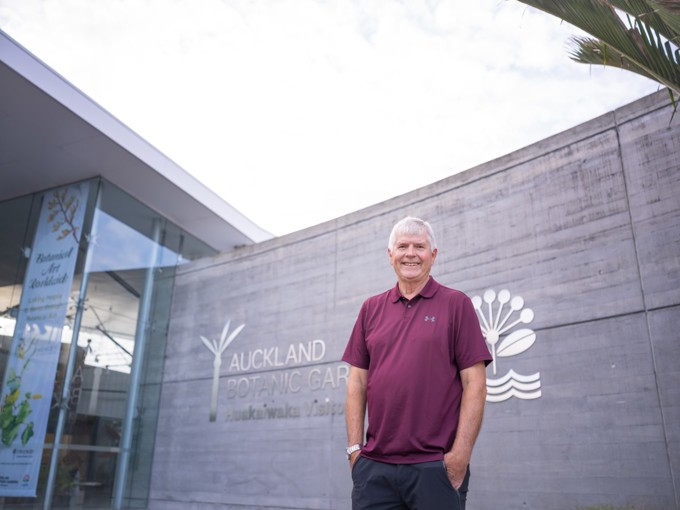
New Year Honours: celebrating Jack Hobbs (MNZM)
December 30, 2025
Big Sky Announces Broadcast Schedule for Conference Men’s Basketball Games
December 30, 2025
Secretary Rubio’s Call with UAE Deputy Prime Minister and Foreign Minister Sheikh Abdullah bin Zayed Al Nahyan – U.S. Department of State (.gov)
December 30, 2025
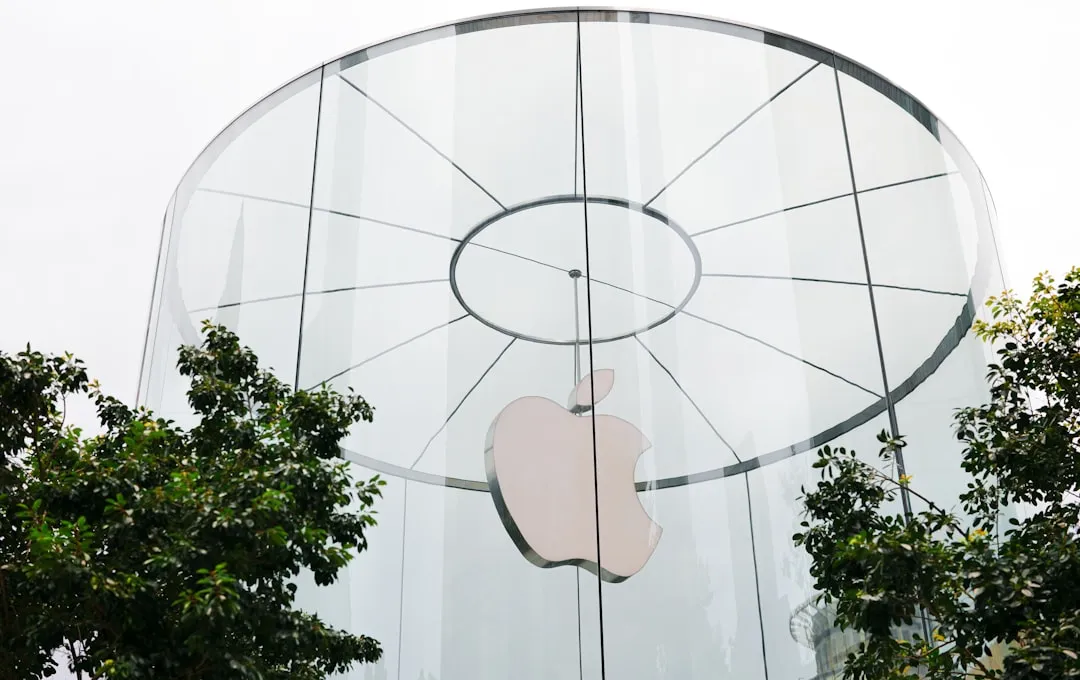
Apple Pay Raises $3M for AIDS Fight in Just 10 Days
December 30, 2025
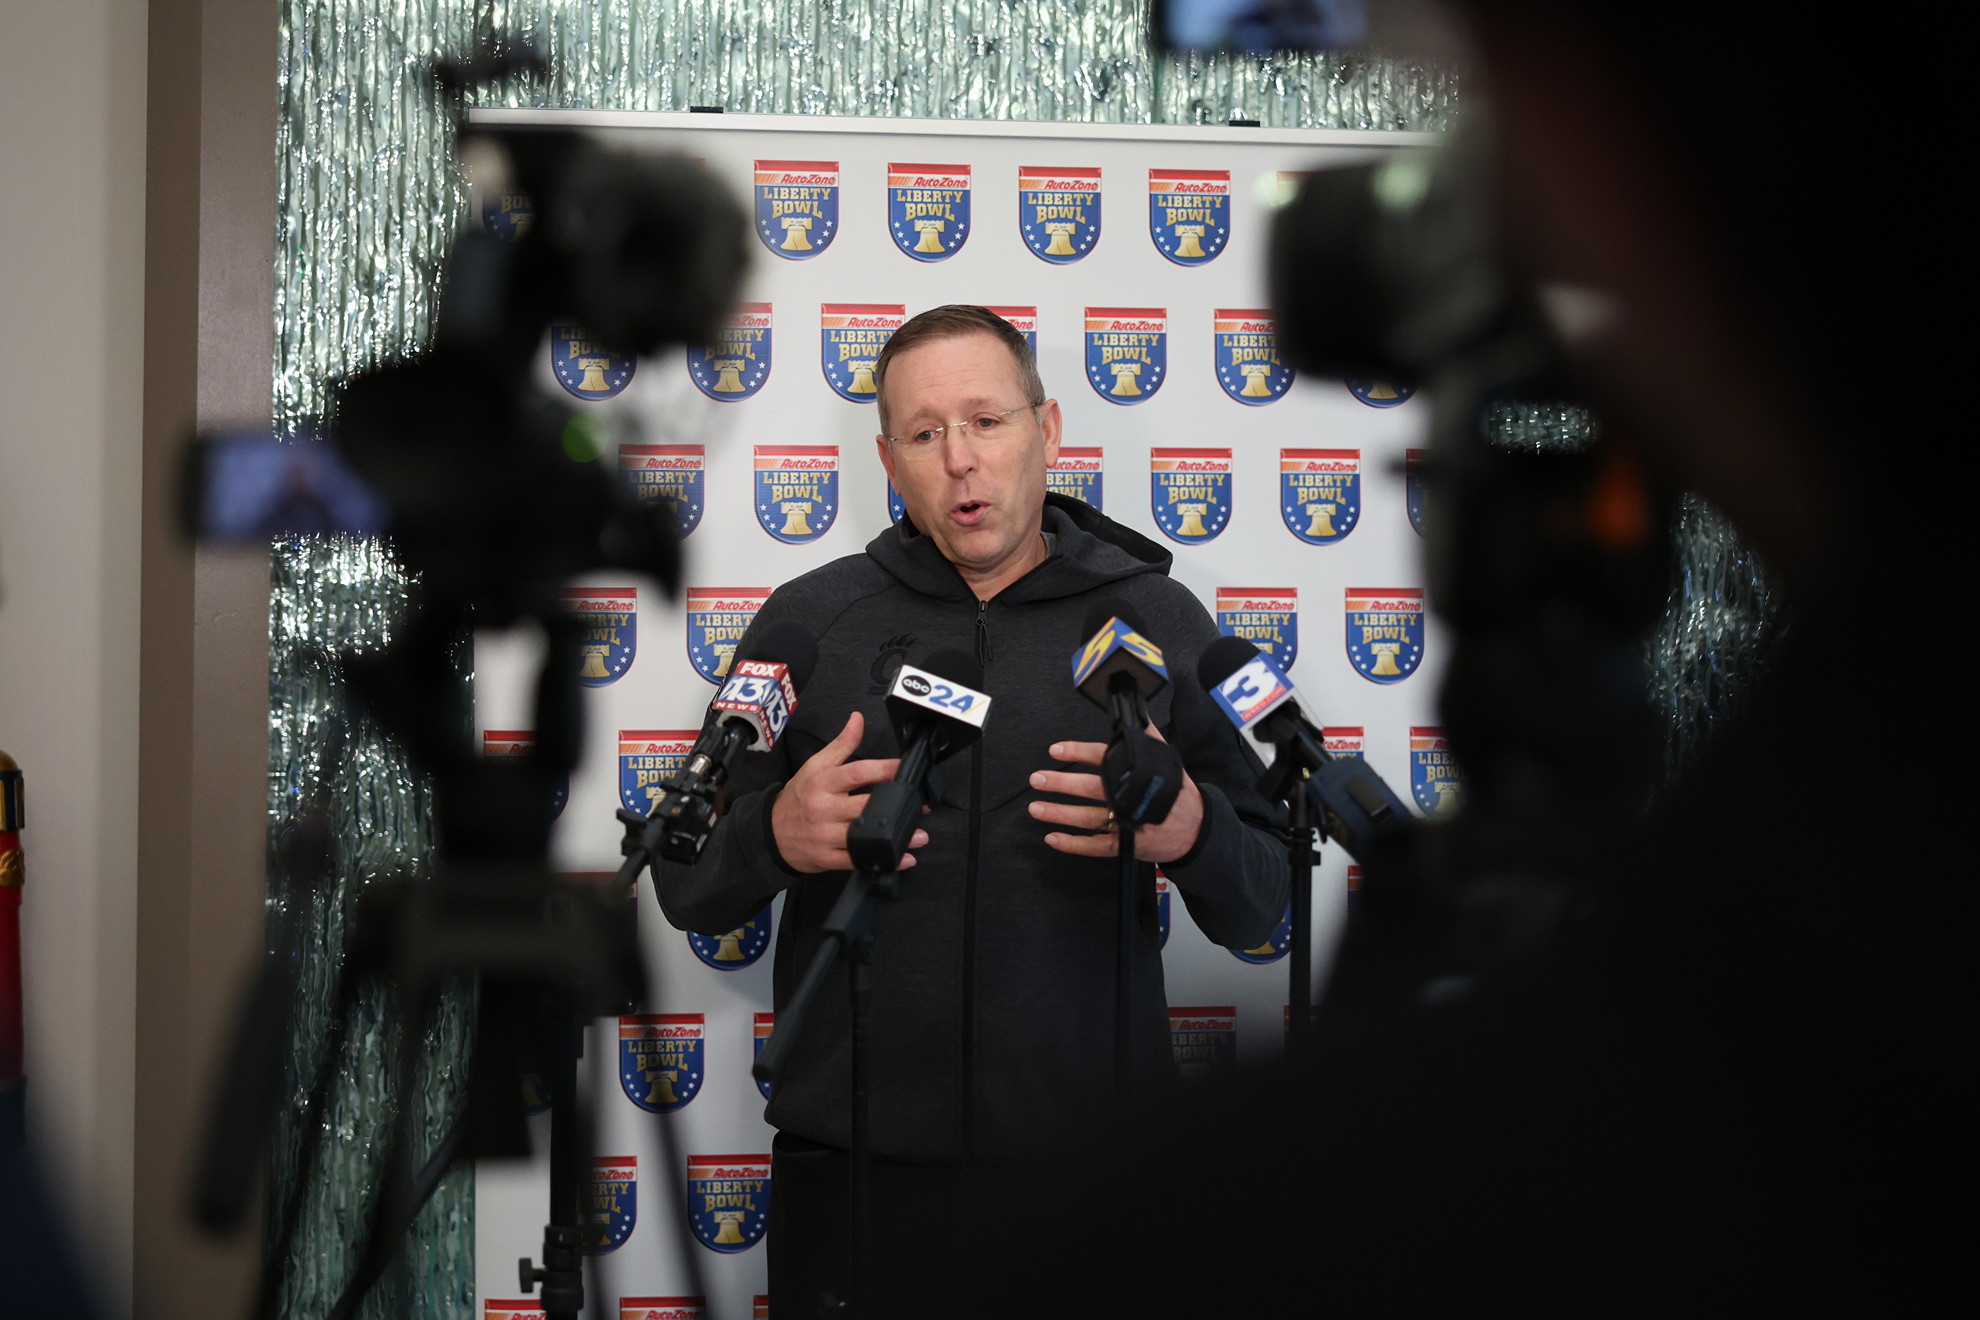
Bearcats Land in Memphis for AutoZone Liberty Bowl – University of Cincinnati Athletics
December 30, 2025
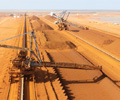
CHAMPION IRON PROVIDES AN UPDATE ON A THIRD-PARTY TRAIN DERAILMENT
December 30, 2025
Police investigation of Bondi Beach antisemitic shooting finds no evidence of ‘broader terrorist cell’
December 30, 2025
Iron ore falls as growing shipments weigh
December 30, 2025