Qaasid News
Download Our App
Latest News from Pakistan
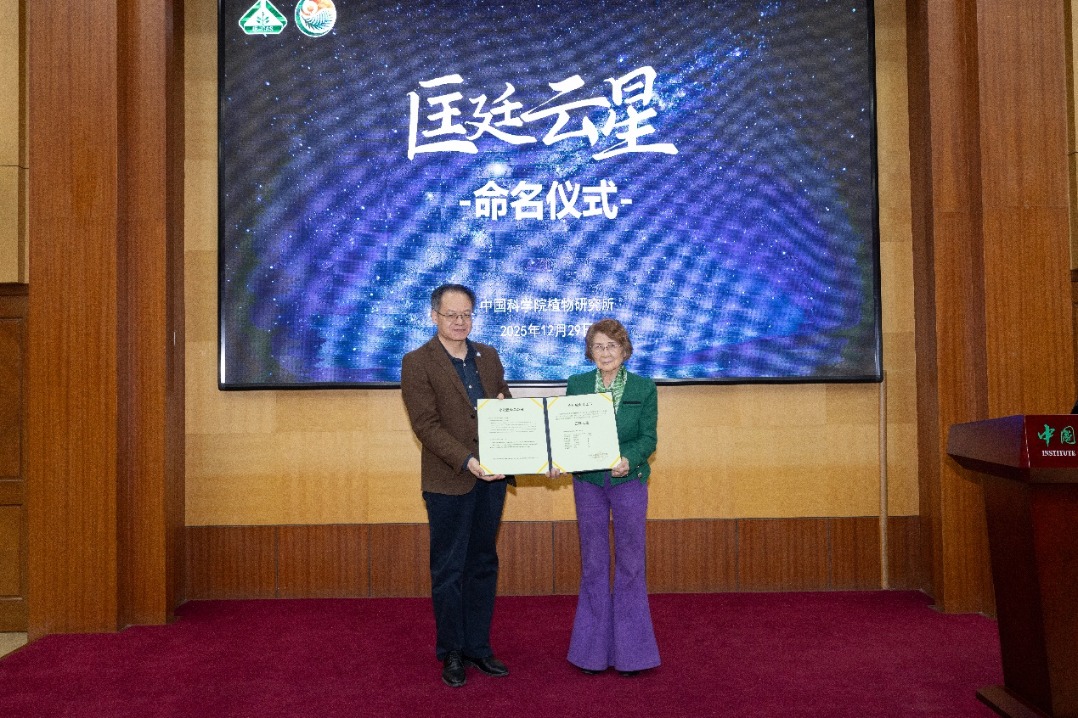
Asteroid named after Chinese botanist Kuang Tingyun
December 30, 2025
Saudi Arabia bombs UAE-backed faction in Yemen
December 30, 2025
Devon residents asked to donate used Christmas trees for otters
December 30, 2025
Asteroid named after Chinese botanist Kuang Tingyun-Xinhua
December 30, 2025
Tyler Perry’s accuser sent messages of gratitude and friendship years after alleged assault
December 30, 2025
Beyoncé joins the billionaire club and here’s how she compares to music’s richest stars – Hum News English
December 30, 2025
Wifaq ul Madaris bans seminaries from collecting funds from students for convocations
December 30, 2025
Australian police find no evidence of ‘broader terrorist cell’ in Bondi Beach antisemitic shooting
December 30, 2025
Sindh govt to establish 1,420 Non-Formal Education centers – RADIO PAKISTAN
December 30, 2025
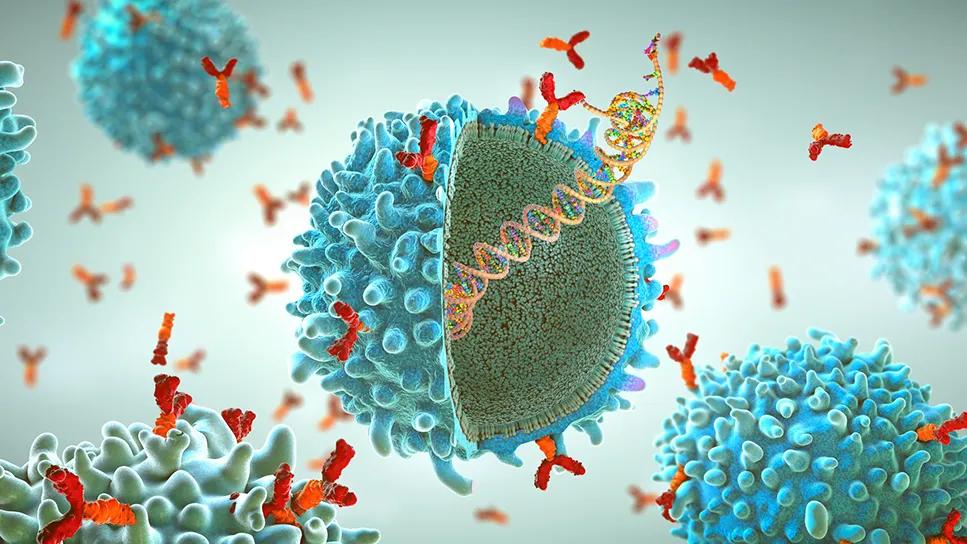
Visit the Biologic Therapies Summit Via Webcast
December 30, 2025