Qaasid News
Download Our App
Latest News from Pakistan
Consensus Statement Declares All Forms of Nicotine Are Cardiovascular Toxins – Rheumatology Advisor
December 30, 2025
The Belgian company at the heart of a tussle over Russia’s frozen assets – Financial Times
December 30, 2025
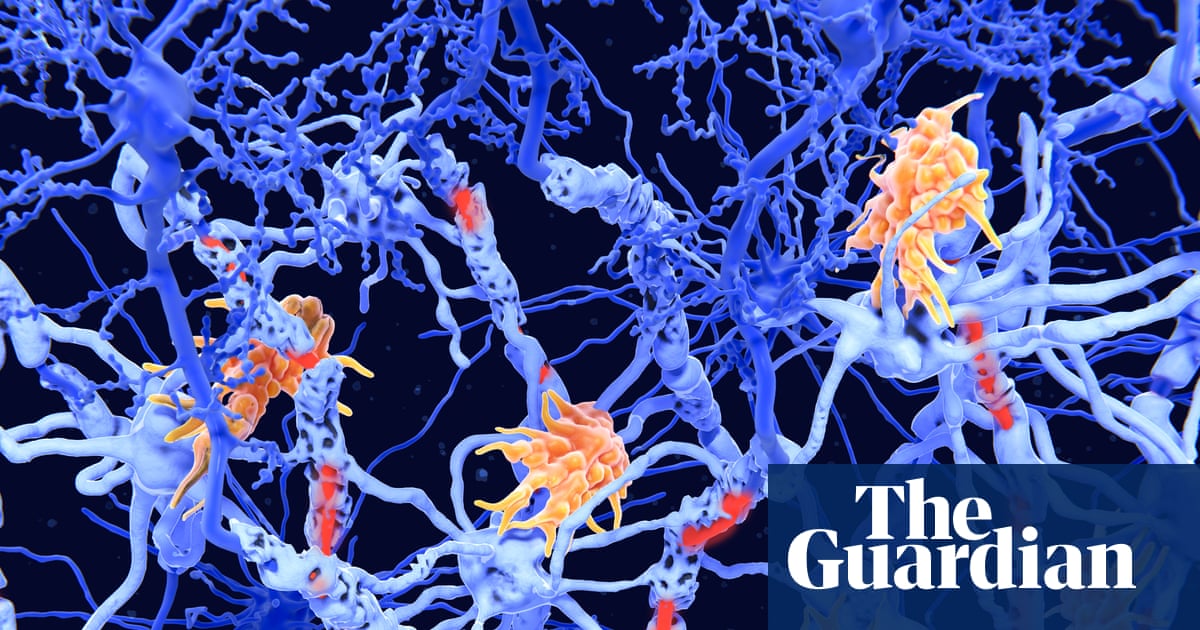
Two new subtypes of MS found in ‘exciting’ breakthrough | Multiple sclerosis
December 30, 2025
Dr Syed Amir Ali appointed CEO of Meezan Bank
December 30, 2025
No. 2 Badgers dropped by No. 7 Broncos in Holiday Face-Off title game
December 30, 2025
Durkin Paces Gophers in Final Nonconference Game
December 30, 2025
Huskies fell to No. 3 Spartans in GLI Championship
December 30, 2025
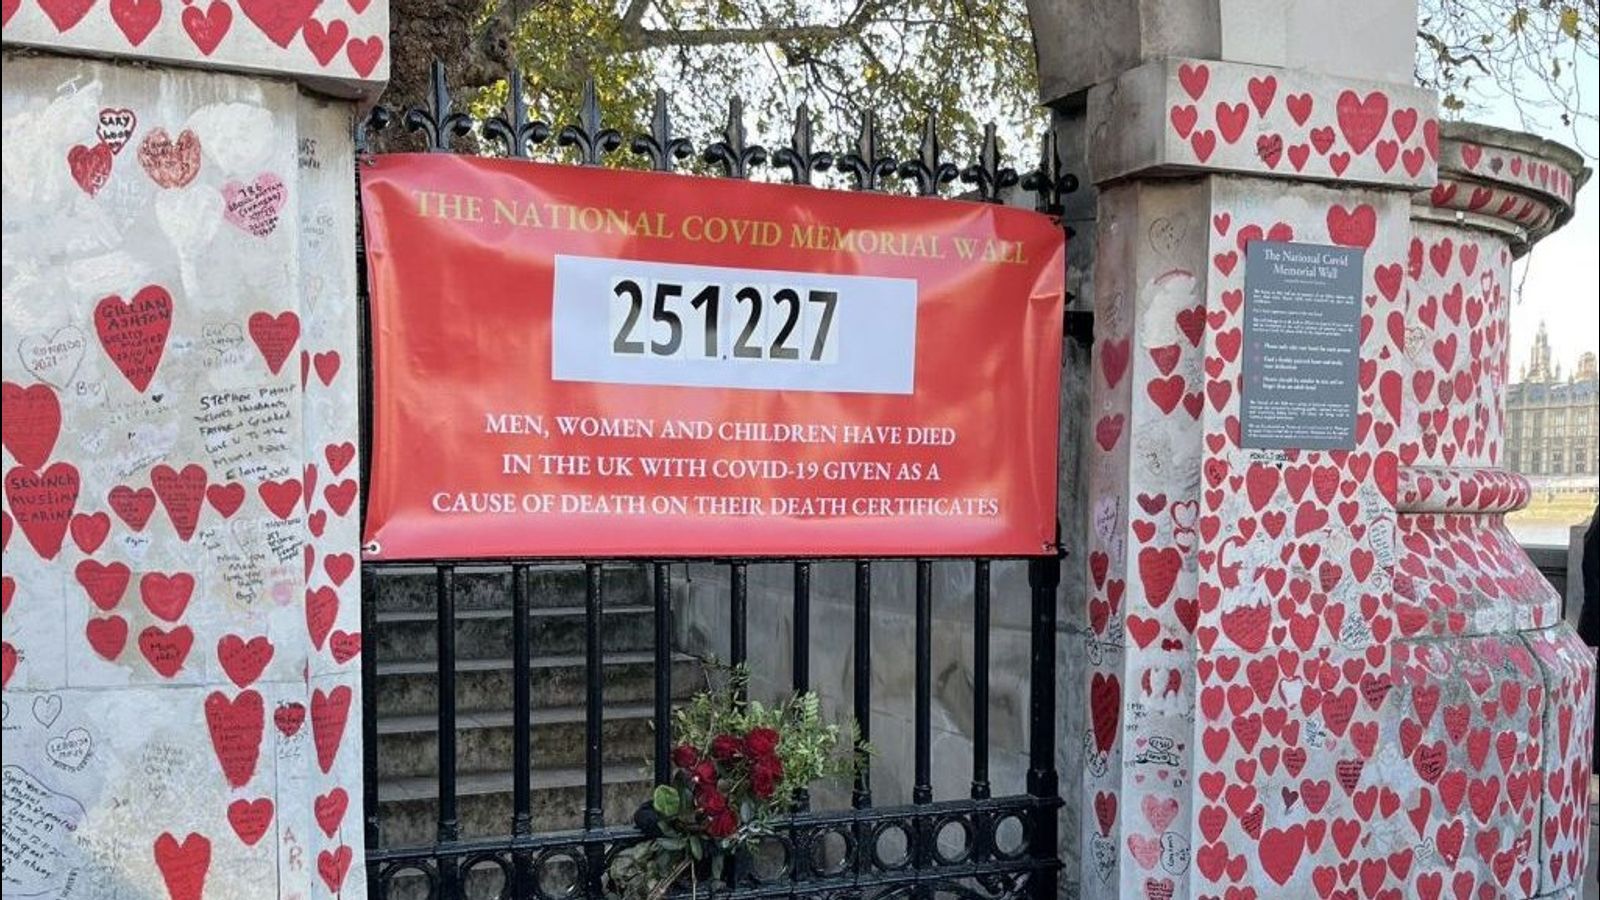
Long COVID and the concealment of pandemic harm
December 30, 2025
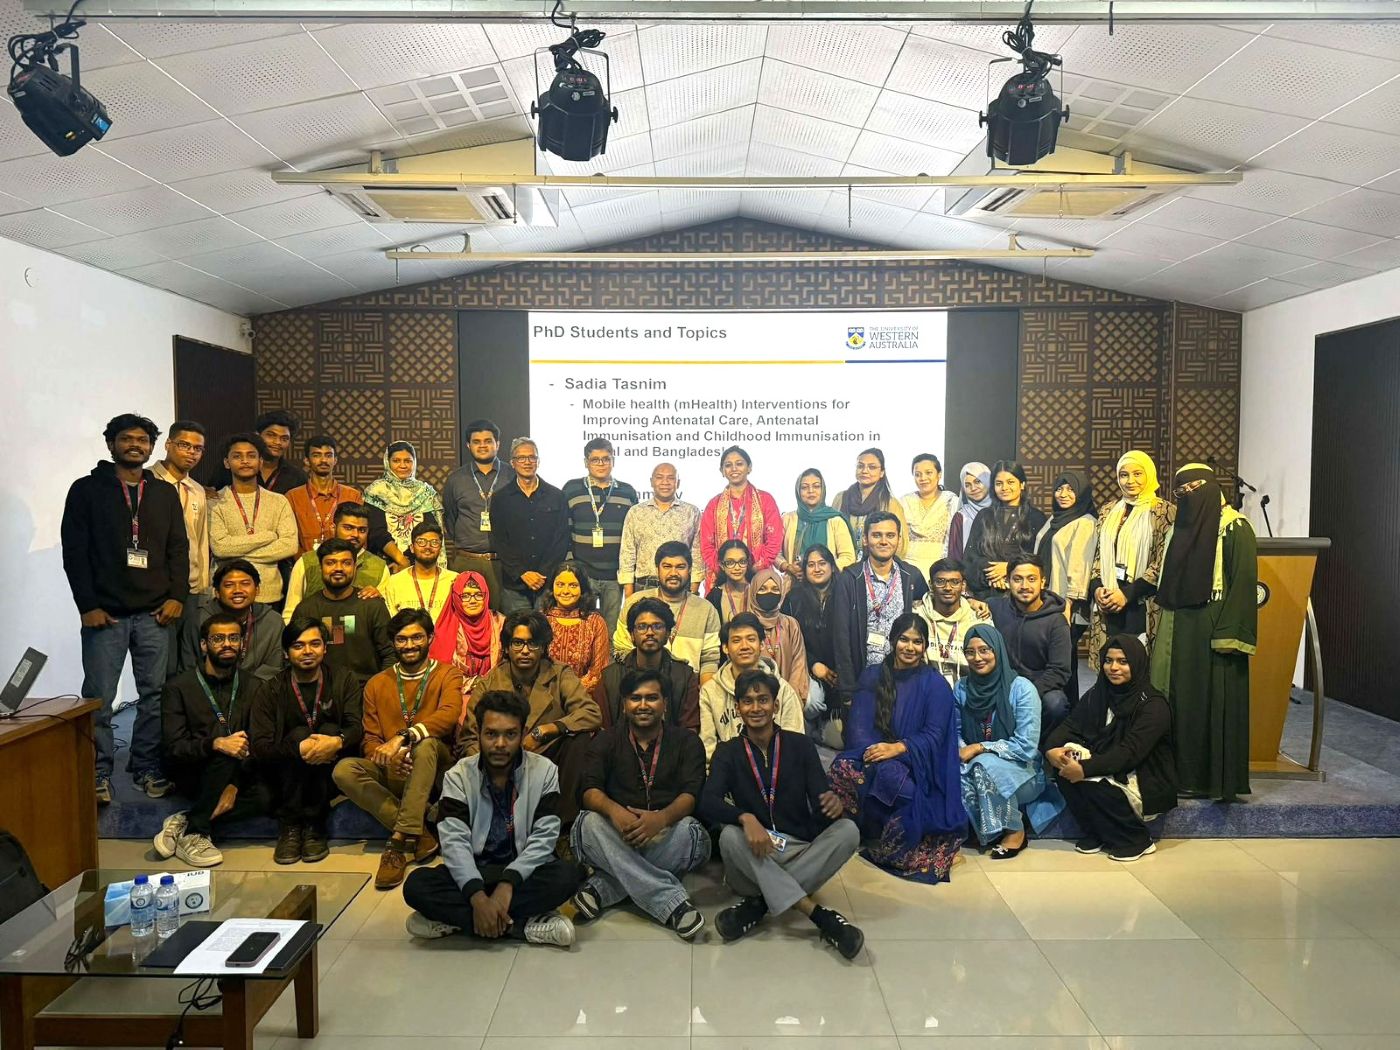
Academic Session on “Higher Education in Australia: Career Pathways in a Global Economy”
December 30, 2025
Forensic gemmological investigation based on optical and crystal-chemical changes in topaz from Ouro Preto and Caraí, Brazil, induced by heat treatment
December 30, 2025