Qaasid News
Download Our App
Latest News from Pakistan
Nuclear submarine arms race heats up between North and South Korea
December 26, 2025
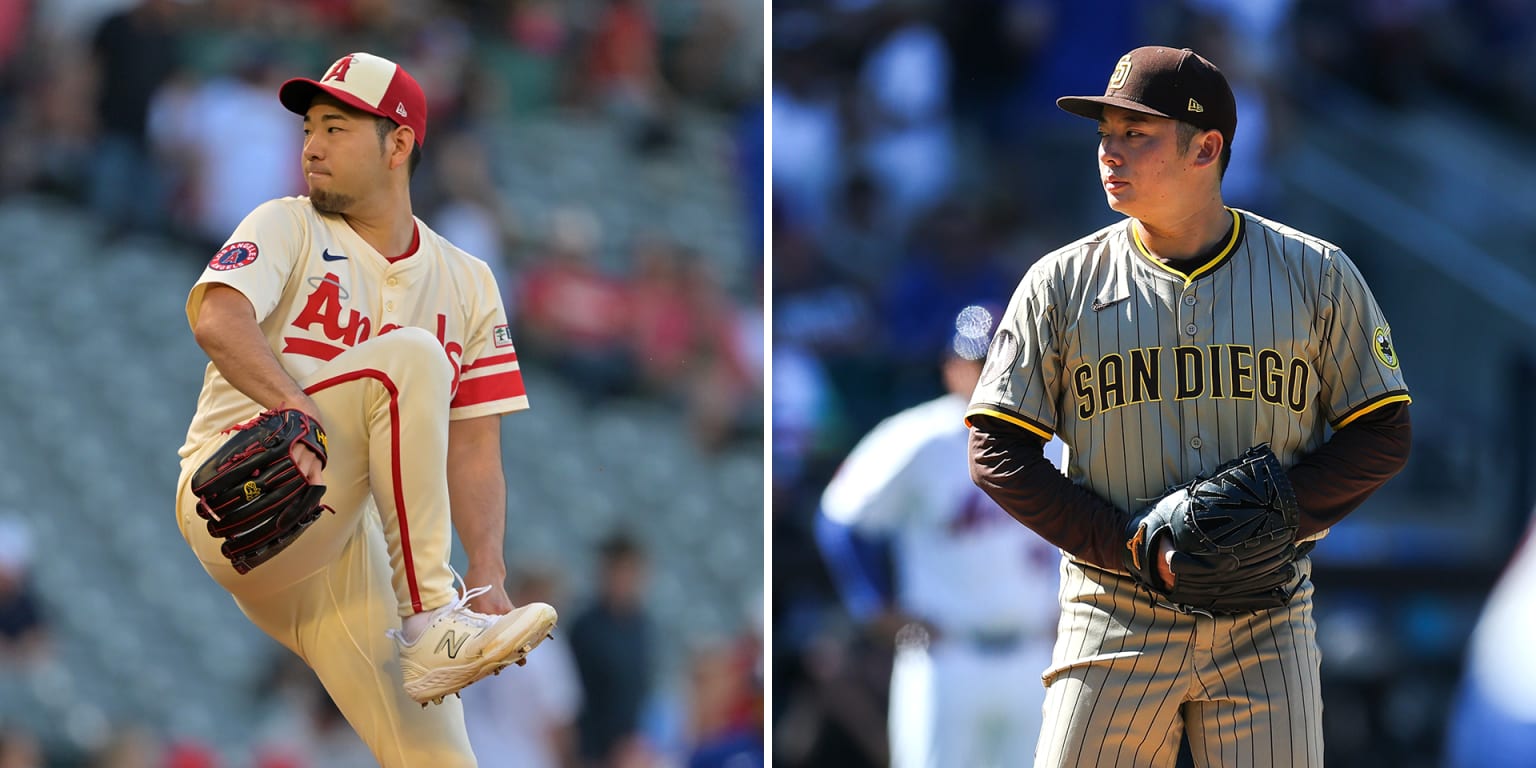
Yusei Kikuchi, Yuki Matsui among adds to Samurai Japan for 2026 World Baseball Classic
December 26, 2025
What’s New in Tampa Bay: January/February 2026
December 26, 2025
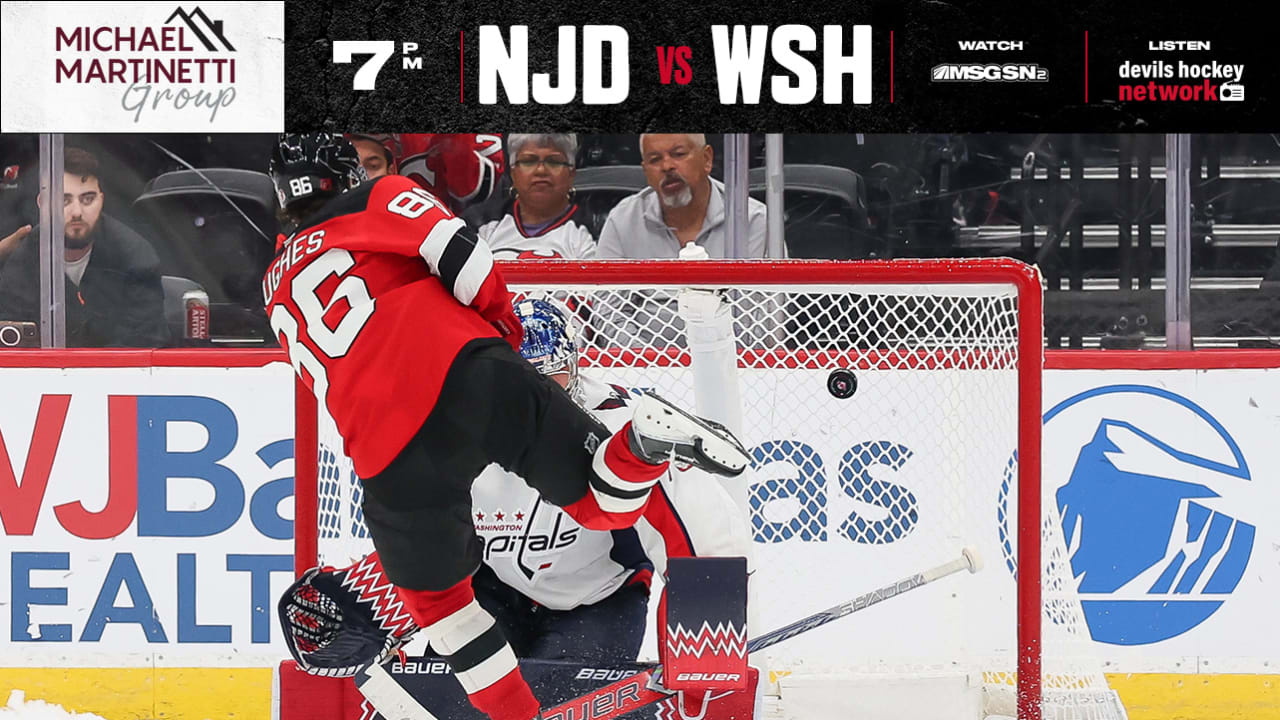
Devils Host Capitals Following Holiday Break | PREVIEW
December 26, 2025
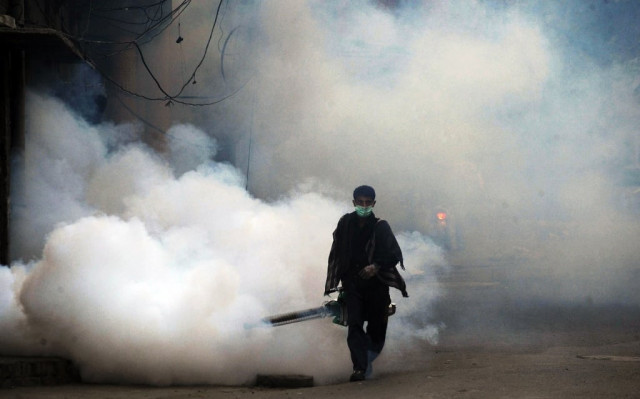
Dengue workers denied official mobiles, internet
December 26, 2025
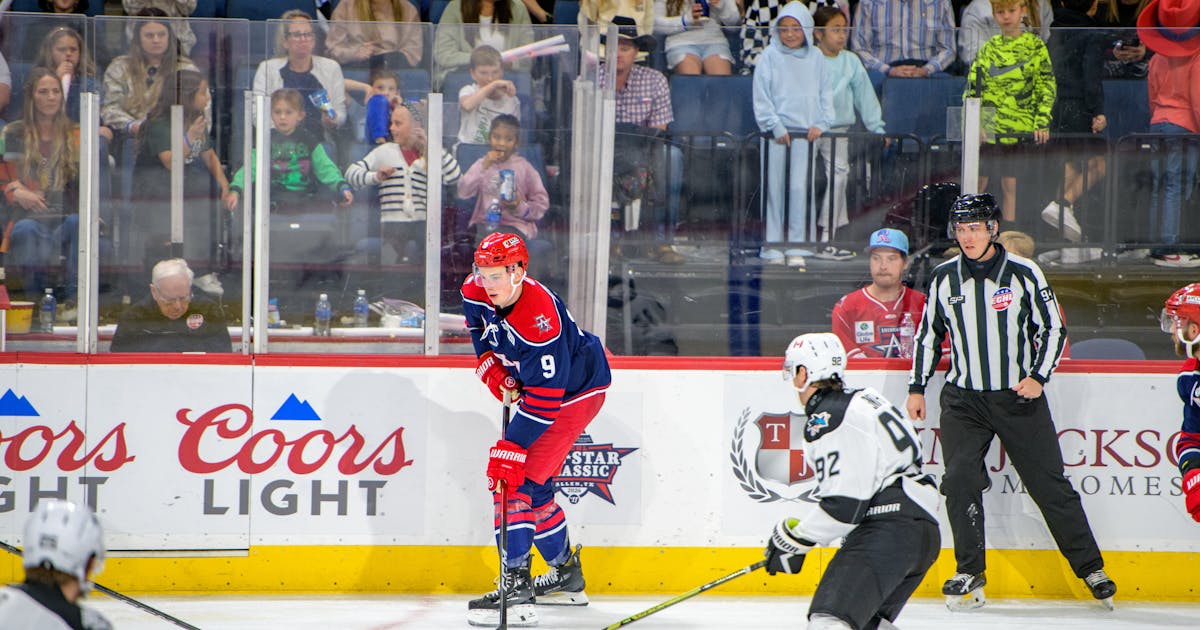
Allen Americans | Americans at Wichita Tonight Postponed
December 26, 2025
Researchers Unveil a 4D Blueprint of the Human Genome – SciTechDaily
December 26, 2025
Open your hearts to baby Jesus and one another, pope says on Christmas – Chicagoland
December 26, 2025
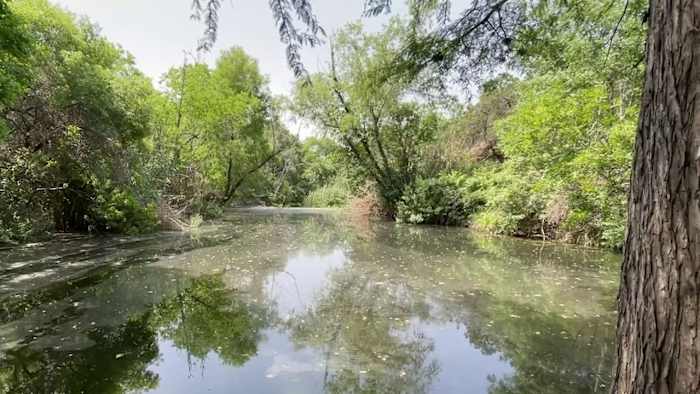
TCEQ declines to reconsider wastewater permit for controversial Guajolote Ranch development
December 26, 2025
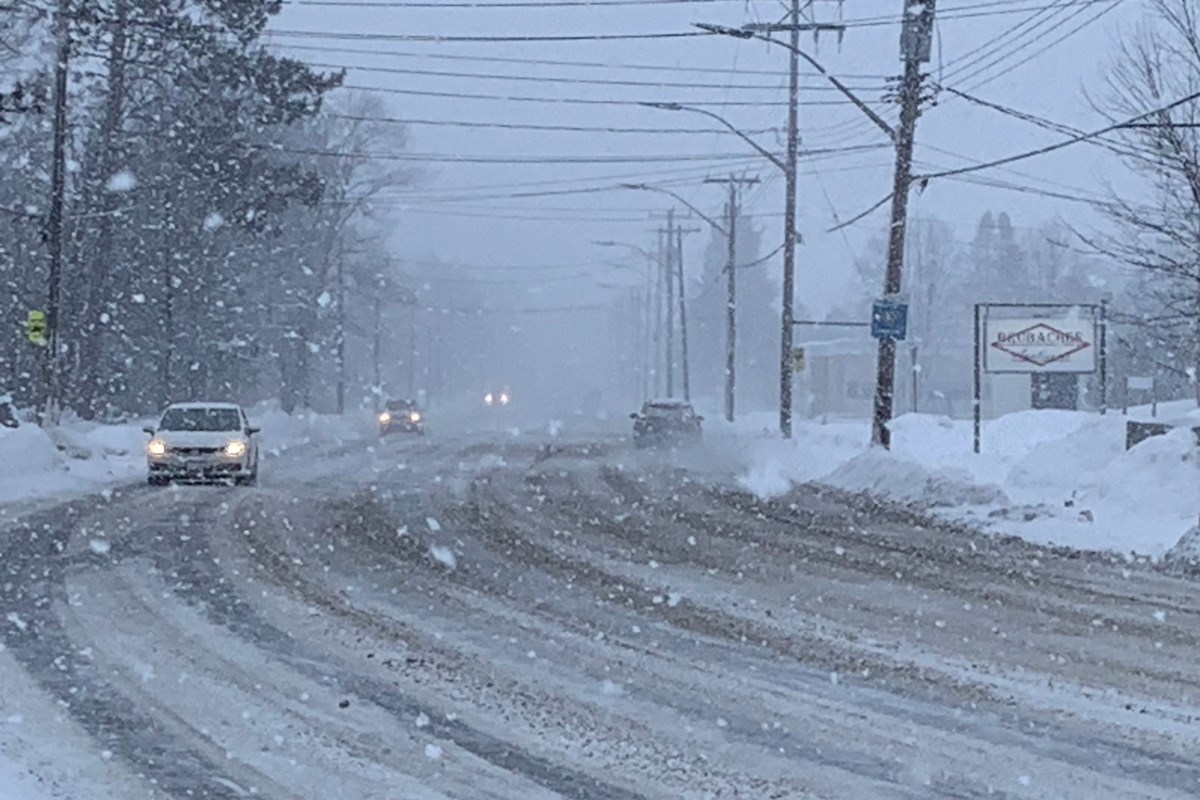
Significant snowfall expected in North Bay and surrounding areas
December 26, 2025