Qaasid News
Download Our App
Latest News from Pakistan
Airborne DNA reveals decades of biodiversity loss
December 24, 2025
49ers Host Annual ‘Hope for the Holidays’ Event 🎄
December 24, 2025
WR Chris Godwin Jr. Spurs Conversion Rate on Third Down
December 24, 2025
Chinese technology helps Iraq develop smarter oilfields-Xinhua
December 24, 2025
Thai-Cambodia ceasefire talks resume, but clashes continue
December 24, 2025
Looking at Philip Rivers and Alec Pierce’s prime time performances in Week 16
December 24, 2025
5th person hospitalized in E. coli outbreak linked to Pillsbury brand Pizza Pops
December 24, 2025
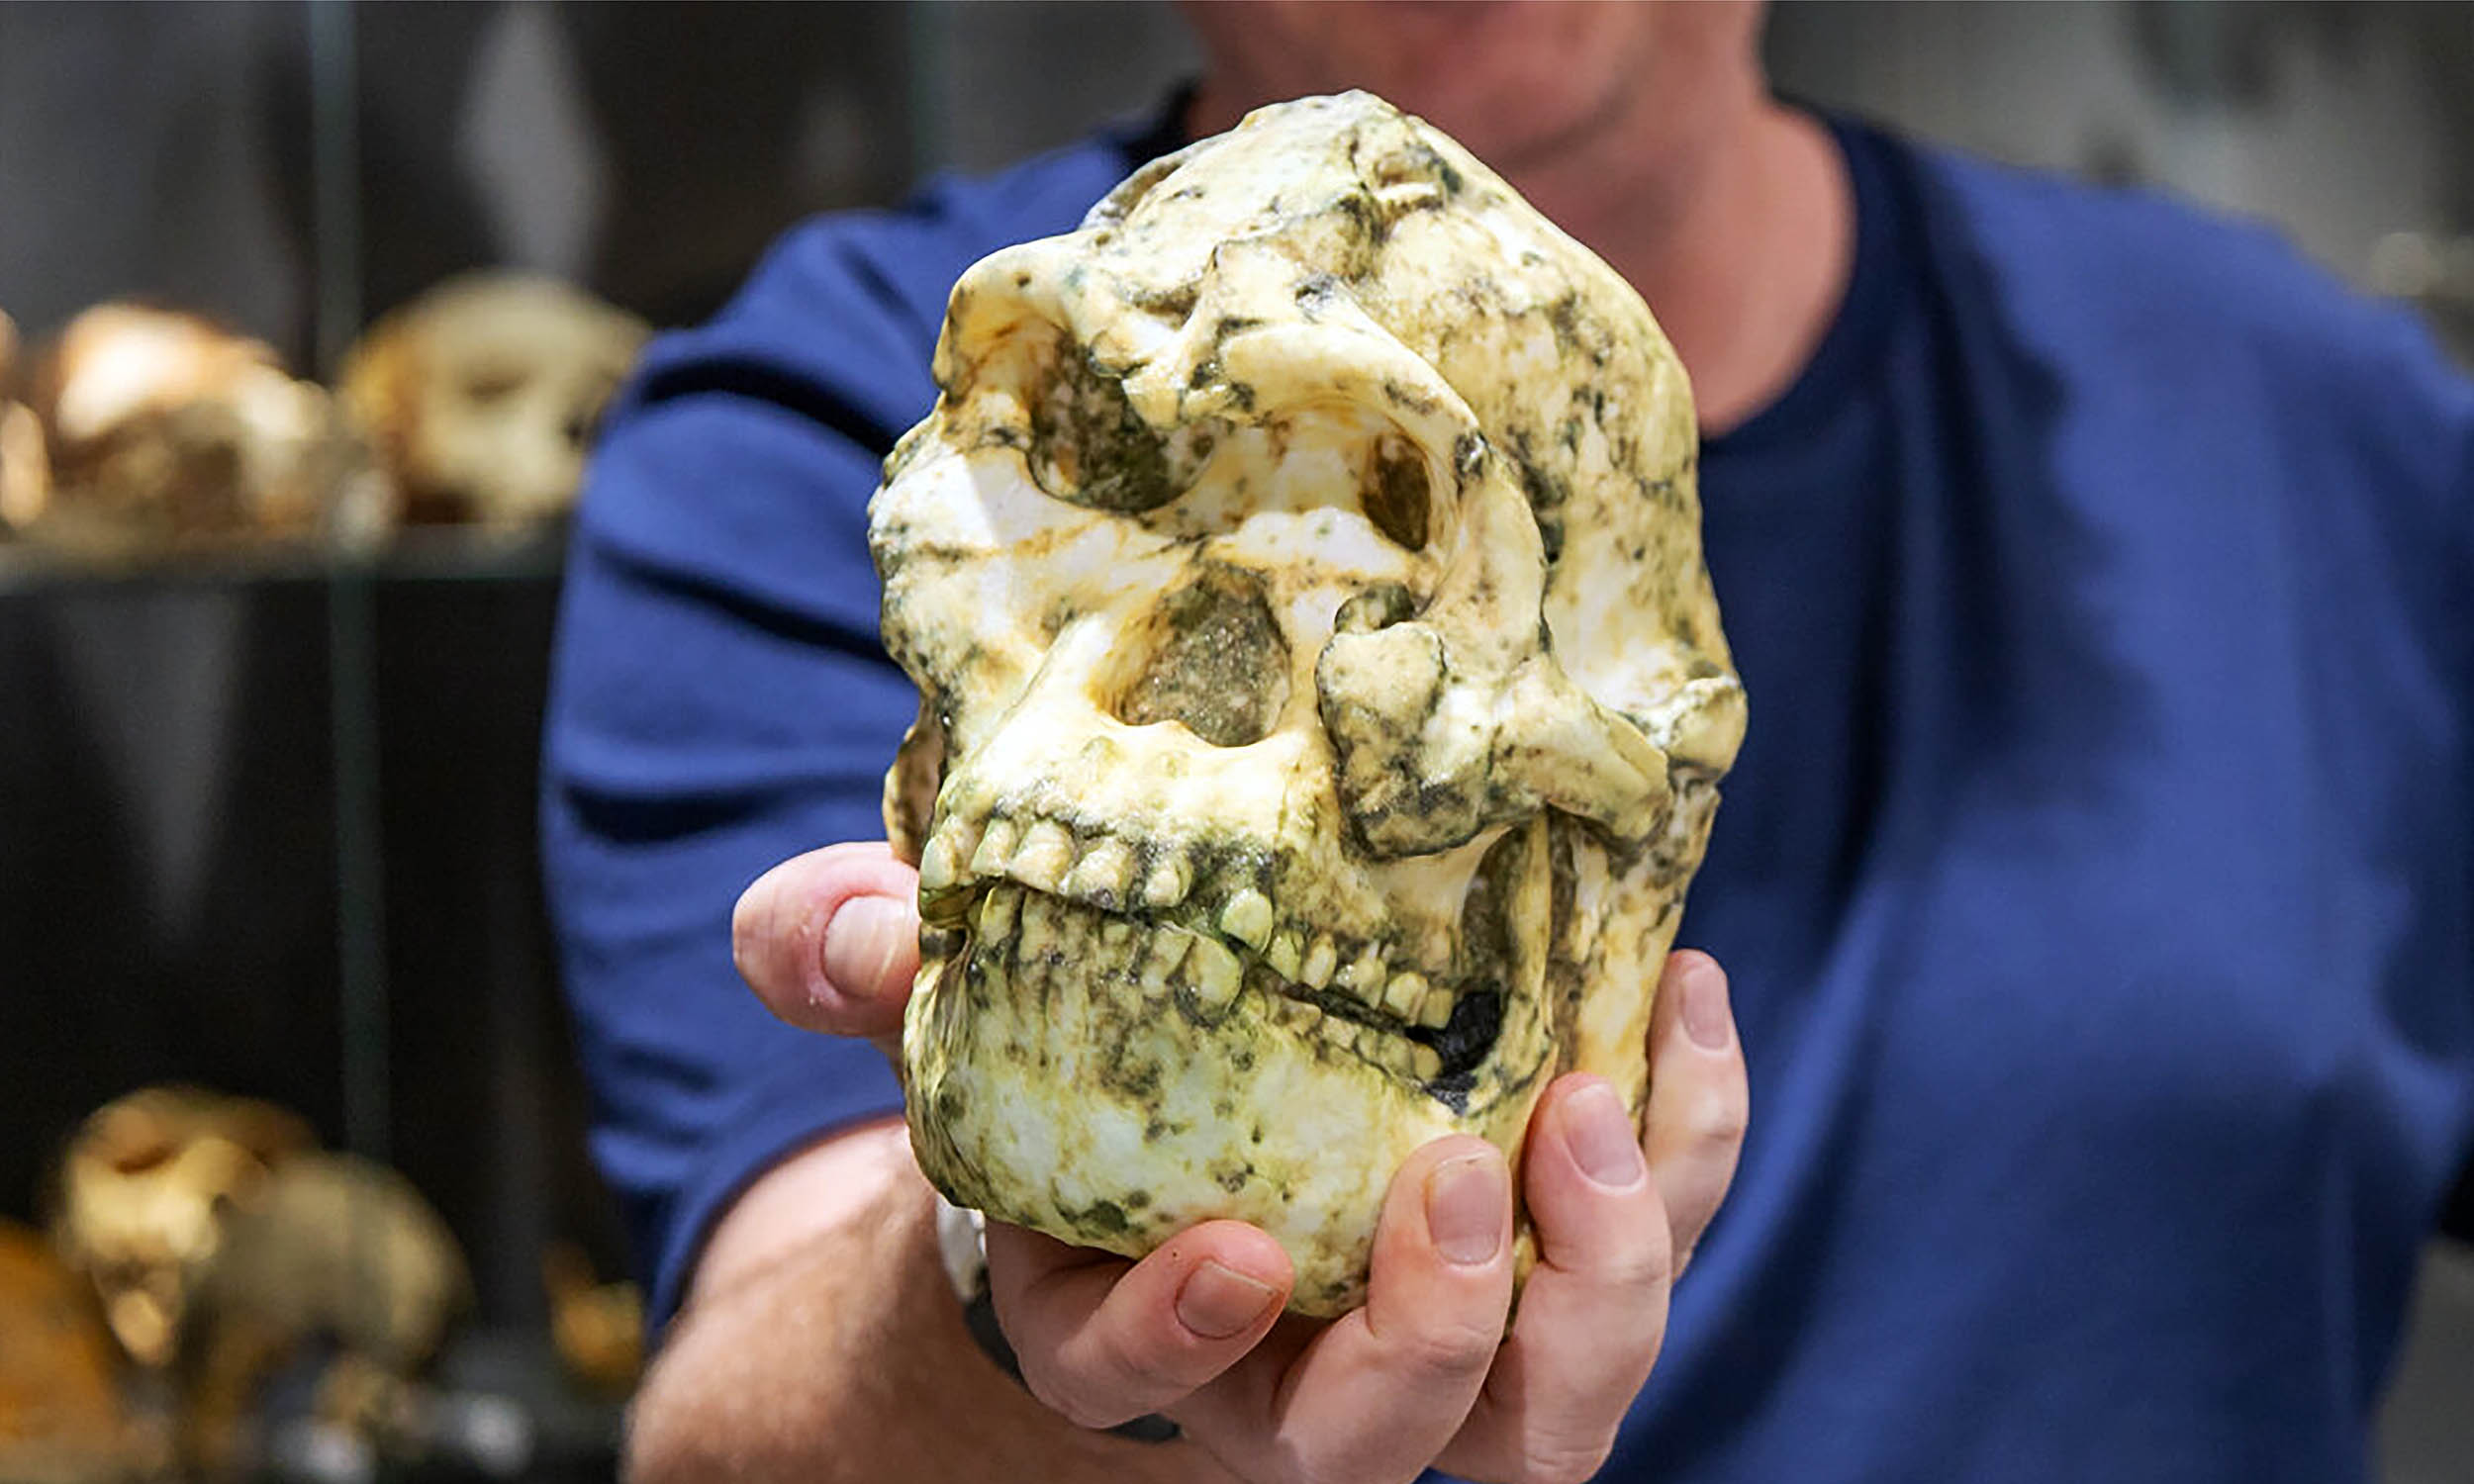
‘Little Foot’ fossil might be a completely new human species
December 24, 2025
Continent-wide view of genomic diversity and divergence in the wolves of Asia
December 24, 2025
Live Christmas Tree Recycling Program opens December 26 | News Releases | City Of Yuma, AZ – City Of Yuma, AZ (.gov)
December 24, 2025