Qaasid News
Download Our App
Latest News from Pakistan
Kim Kardashian reveals struggles behind holiday photo with kids
December 23, 2025
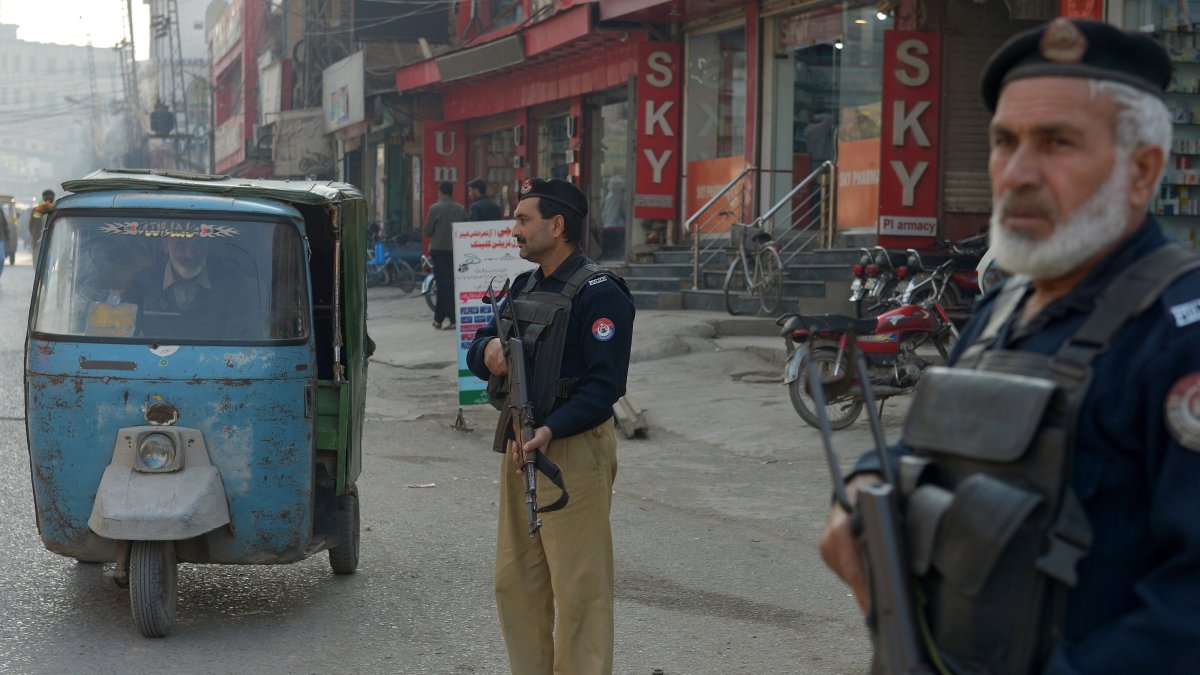
Five Pakistani police personnel killed in 'gun and bomb' attack – Reuters
December 23, 2025
Himalayan Glacial Degradation Presents a Transboundary Environmental Security Risk to Pakistan: An Open Letter to the Deputy Prime Minister
December 23, 2025
Likely terrorist attack on Pakistani police vehicle kills 5 officers
December 23, 2025
Predictive Value of High Sensitivity C-Reactive Protein/Albumin Ratio
December 23, 2025
AFCON 2025: Mohamed Salah rescues Egypt in 91st minute, Foster stunner – daily round-up
December 23, 2025
PHL WORKS Earns ACI-NA Award for “Customer Service Through People”
December 23, 2025
Andrew suffers humiliation as ‘Met Police make visit to his home’ | Royal | News
December 23, 2025
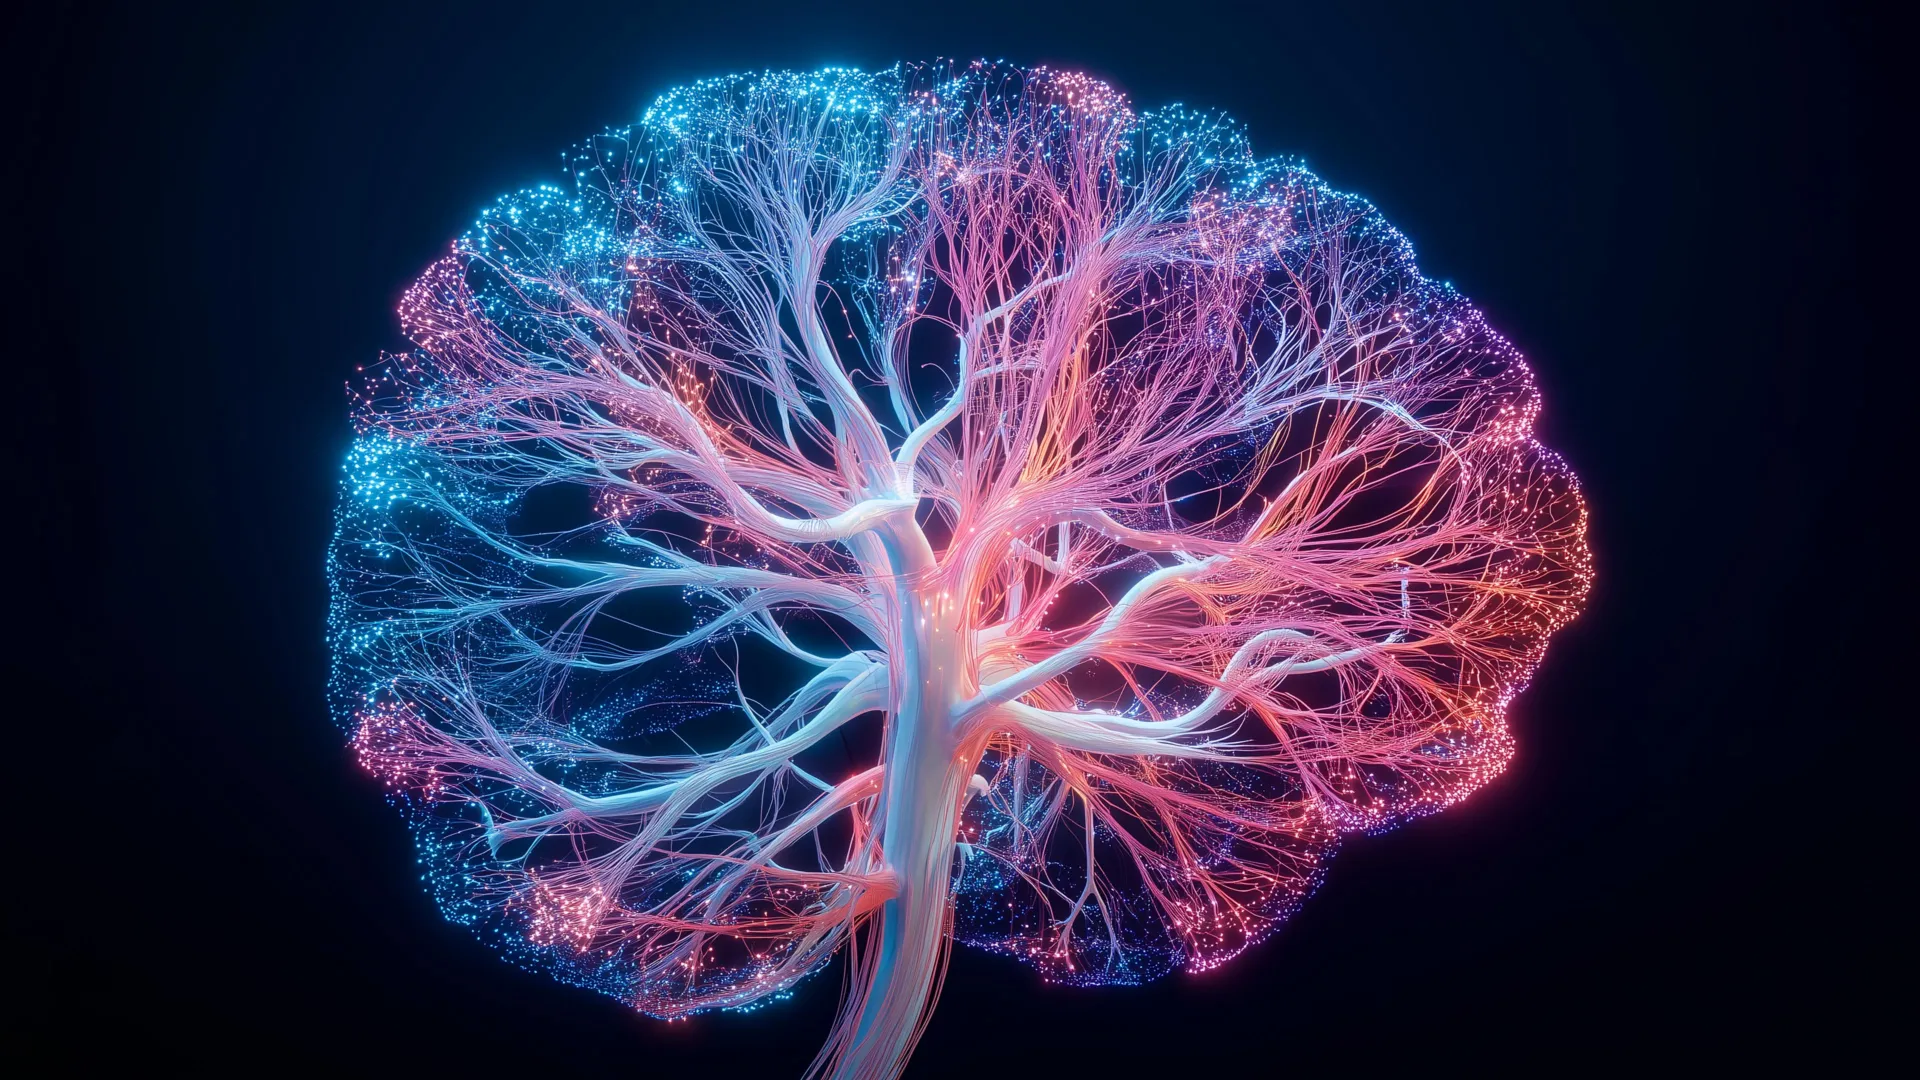
Hidden brain maps that make empathy feel physical
December 23, 2025
Five easy ways to boost your collagen for plumper skin over 50
December 23, 2025