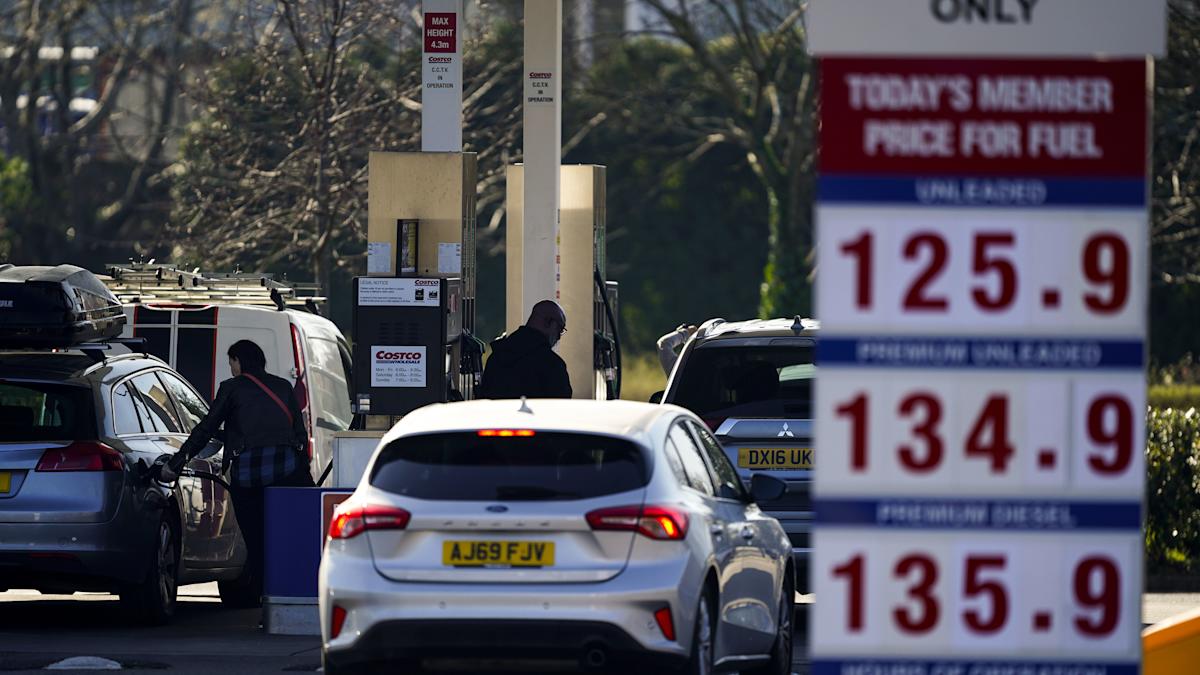
Conflict in the Middle East has been unleashing turmoil in the world’s financial markets and has pushed wholesale oil prices to levels not seen for years.
This has ignited worries about the possible knock-on effects to economies around the world, and how it will impact the cost of living for households up and down the UK.
Here, the Press Association looks at how the conflict could affect people’s finances in different ways.
– What’s happening to gas and oil prices?
A major impact of escalating conflict in the Middle East is on the world’s oil and gas supplies.
Prices have been climbing higher amid concerns that the fighting is disrupting supply and limiting the ability to transport to countries around the world.
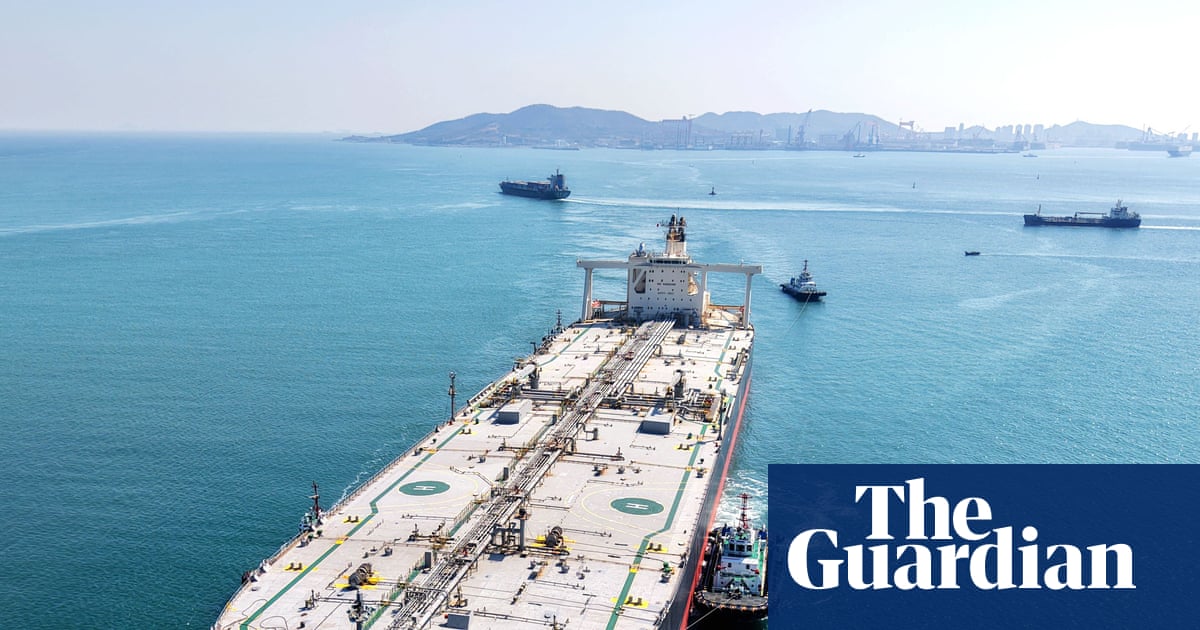
This is because Iran has effectively blocked commercial ships from passing through the Strait of Hormuz, leading traffic through the waterway to reach a near-standstill, according to reports.

The Strait of Hormuz is a crucial shipping route, used by tankers carrying about one fifth of the world’s oil supplies and seaborne gas.
The price of Brent crude – a global benchmark for oil produced from the North Sea – has shot passed 100 dollars a barrel to reach levels not seen since the summer of 2022.
Natural gas prices have also been soaring after Qatar’s state-backed energy company QatarEnergy last week said it had halted production of liquified natural gas because of attacks on its facilities.
– What does this all mean for my energy bill?
The UK imports oil and liquified natural gas (LNG) from a variety of places, not just the Middle East.
However, if supplies passing through the Strait of Hormuz are disrupted, then demand for alternatives go up and there could be a significant rise in gas and electricity prices, which is what happened after Russia’s invasion of Ukraine in 2022.
This is because wholesale gas prices feed through into electricity prices and how much it costs to heat people’s homes.
Analysts at Cornwall Insight have forecast that household energy bills could rise by 10% from July following sharp increases in wholesale gas prices.
This would mean Ofgem’s price cap for July to September surges to £1,801 a year for a typical dual fuel household – an increase of £160 or 10% on April’s cap.
However, it said the final price cap figure would be based on average wholesale prices over a three-month period, meaning that it would depend on how long gas prices stayed elevated and how long the period of volatility continued.
Meanwhile, National Gas, which owns and operates Britain’s gas network, said it had no concerns about the security of gas supplies at the current time.