Category: 3. Business

  • Lucid misses Q1 vehicle delivery estimates on supplier disruptions

    Lucid misses Q1 vehicle delivery estimates on supplier disruptions

    A Lucid ‘Gravity’ SUV is displayed during the press day preview of the Los Angeles Auto Show in Los Angeles, California, U.S. November 16, 2023.

    David Swanson | Reuters

    Lucid Group missed expectations for ⁠first-quarter vehicle deliveries on Friday, hurt by a temporary sales halt and recall ​tied to an unauthorized ​supplier change.

    Deliveries of its electric luxury SUV, Lucid Gravity, were disrupted for 29 days during the quarter due to a supplier quality issue with ⁠second-row ‌seats, limiting the company’s ability to meet ⁠customer demand.

    The company said it produced 5,500 vehicles and delivered 3,093 in the quarter ended March 31. Analysts at Visible Alpha had expected Lucid to ‌produce 5,967 vehicles and deliver 5,237 vehicles.

    Deliveries were particularly hit in February, said Chief Executive Marc Winterhoff, when Lucid ​paused to reverse the change and inspect vehicles already produced.

    Lucid recalled 4,476 Gravity SUVs earlier this week over seatbelt anchor welds that did not meet safety standards, built between December 2024 and February 2026.

    The shortfall also highlights the persistent gap between the company’s production and its ability to get cars into customers’ hands, a challenge that has plagued Lucid and other EV startups as demand cools.

    Supply challenges continue to be a concern, Winterhoff has said, acknowledging that the company was being conservative in its forecast of producing 25,000 to 27,000 vehicles this year, implying growth could top 50%. On Friday, it maintained that forecast.

    In 2025, ​production nearly doubled to 17,840 ‌vehicles.

    Along with a hit from high tariffs on auto parts imports, Lucid, like some of its rivals, has been contending with a chip shortage, uncertain rare-earth supplies, and a September fire ​at an aluminum supplier.

    Choose CNBC as your preferred source on Google and never miss a moment from the most trusted name in business news.

    Continue Reading

  • The Iran War Is Reshaping Global Aviation

    The Iran War Is Reshaping Global Aviation

    (Bloomberg) — For years, airlines in the US and Europe have gawked at the rise of Middle East carriers funneling ever more passengers through their gleaming hubs in Dubai and Doha at competitive prices with the latest jets.

    Emirates, Qatar Airways and Etihad Airways offered a viable alternative in the Gulf, leveraging a perfect position between three continents – Europe, Africa and Asia.

    That dynamic changed almost overnight when the Iran war broke out, shuttering airspaces, grounding planes and leaving regional airlines in disarray. While the loss of capacity from the Middle Eastern carriers has reduced long-haul flying overall, Western airlines are moving in to fill the gap.

    Executives have sensed an opportunity to take advantage and regain ground, adding alternative routes to steal away business. Deutsche Lufthansa AG, British Airways and Air France-KLM quickly redeployed jets into countries including India, Thailand and Singapore last month to capture passengers looking for new flights. The gains in share are small so far, however, and building something with lasting momentum isn’t simple.

    Bloomberg analyzed widebody flights across 21 major airlines in the month before and after the war began, using data from tracking firm Flightradar24.(1)

    One issue will be whether this is a short-term blip for global air travel or prove to be a more lasting change as places once considered safe are tainted with the long shadow of war.

    For European carriers trying to steal a march on rivals, another challenge is surging fuel prices as the war disrupts energy markets. That means either fare hikes or absorbing those costs to lure in new customers, with little sense of how long the conflict will continue.

    The Middle East airlines “won’t have shelved their ambitions to be global hubs,” said Rob Walker, an aviation analyst at consultancy ICF. “The Europeans, they’ve just got to try and make hay while the sun is shining.”

    So far, the big increase in flight capacity has been in the US, though that reflects plans that were in motion before the Middle East disruption.

    The biggest carriers, such as United Airlines and Delta Air Lines have expanded long-haul widebody flying by 11% and 12%, respectively, according to tracker Flightradar24. They added flights to existing destinations in Europe, as well as new routes to cater to well-heeled American tourists.

    Jet Fuel

    US airlines are more exposed to surges in jet fuel prices as they’re not hedged, though they enjoyed a bump in demand last month as passengers pounced to book before those costs pushed up fares.

    On the Middle East disruption, nonstop flights from the US to Asia will benefit, as will transatlantic routes where US airlines code-share with European carriers, according to Walker.

    The longer the war persists, the worse it will be for the carriers with bases in the Middle East. US President Donald Trump this week remained vague on the timeline of the war and pledged more aggressive actions against Iran.

    Given its geographical advantage, Turkish Airlines also gained market share in the month after the war began, while Qatar Airways lost the most, according to the data analyzed by Bloomberg.

    Lufthansa saw a pickup in short-term demand, but wants to make these new route switches more permanent. Chief Financial Officer Till Streichert said there’s “absolutely” the potential to move capacity to Asia on a more lasting basis.

    Such moves aren’t always straightforward, particularly if there’s an aircraft mismatch. A single-aisle jet serving a European-Gulf route won’t necessarily be suitable for a longer-haul trip to Asia, and new, fuel-efficient widebody aircraft have years-long waiting lists. Plus, opening new routes takes months of preparation involving landing slots, schedules and staffing.

    Meanwhile, worries about a jet fuel shortage have prompted Lufthansa management to ready crisis plans that could involve grounding planes.

    Lufthansa shares are down 17% since the war began. British Airways parent IAG SA has fallen 13% in the same period, while Air France-KLM has dropped 27%. Morgan Stanley and UBS recently cut share-price targets on a number of European airlines, citing fuel costs.

    Price War

    While the end of the war remains unclear, what’s certain is that the Mideast carriers will return to the market hungry to regain ground, and pricing could come into play.

    “I would expect the Gulf carriers to offer highly attractive fares to rebuild traffic via their hubs, so maybe the European carriers will only have a short window of opportunity to exploit high demand and high fares,” said Richard Evans, senior consultant at analytics firm Cirium.

    The Middle East hub model saw Emirates and Etihad enjoy massive growth in recent decades. Emirates carried 55.6 million passengers in 2025, more than quadruple the number ferried just 20 years earlier.

    That helped to make Dubai the world’s busiest international airport, but rivals say the airlines’ expansion was for years sustained by unfair subsidies.

    “It drives me crazy when people say, ‘These Gulf carriers are so amazing, they’ve got brand-new airplanes, they’ve got fantastic new airports’,” Air France-KLM CEO Ben Smith said in an interview last month. “But when you’re in an unlevel playing field, you can produce that.”

    Asian airlines have boosted their long-haul trips too, with Singapore Airlines adding services to London and Melbourne, while Hong Kong’s Cathay Pacific Airways ramped up flights to Paris, Zurich and London. Air India said it’s introduced more services and Australia’s Qantas Airways is also trying to add capacity on European routes.

    Flying between Asia and Europe was already tricky because many Western airlines were forced to dodge Russian airspace following its invasion of Ukraine in 2022.

    The Iran conflict has exacerbated that. With Iranian and Iraqi airspaces closed, aircraft are being routed through narrow strips over Georgia, Azerbaijan and central Asia.

    “The issue for European carriers to Asia is airspace availability, and competing with Asian airlines that are more competitive and can fly over Russia,” said Conroy Gaynor, an analyst at Bloomberg Intelligence. “We think more capacity will end up on the Atlantic but have concerns on whether there is enough demand to absorb a significant increase.”

    (1) Methodology note: Bloomberg analyzed 131,074 flight records between Feb. 1 and March 27, 2026 from Flightradar24, comparing trends before and after the US and Israeli attack on Iran that started Feb. 28. The data is limited to international widebody passenger flights among 21 airlines.Gulf Carriers: Emirates, Qatar Airways, Etihad AirwaysUS: United Airlines, Delta Air Lines, American AirlinesEurope: Air France-KLM, British Airways, Lufthansa, Turkish Airlines, Iberia, Swiss, TAP Air Portugal, ITA Airways, Brussels Airlines, SAS, Austrian Airlines, Martinair, Oceania, QantasAsia: Air India, IndiGo

    ©2026 Bloomberg L.P.

    Continue Reading

  • Oluwadare, O. A., Folorunso, A. F., Ashiru, O. R. & Otoabasi-Akpan, S. I. High resolution 3-D seismic and sequence stratigraphy for reservoir prediction in ‘Stephi’ field, offshore Niger Delta. Nigeria Sci. Rep. 14 (1). https://doi.org/10.1038/s41598-024-73285-z (2024).

  • Falade, A. O., Amigun, J. O. & Abiola, O. Hydrocarbon prospective study using seismic inversion and rock physics in an offshore field. Niger Delta Discover Geosci. 2 (1). https://doi.org/10.1007/s44288-024-00030-4 (2024).

  • Esiri, A., Ozowe, C. & Jambol, D. Enhancing reservoir characterization with integrated petrophysical analysis and geostatistical methods. Open. Access. Res. J. Multidiscipl. Stud. 7 (2), 168–179. https://doi.org/10.53022/oarjms.2024.7.2.0038 (2024).

    Google Scholar 

  • Lawal, A., Yang, Y., He, H. & Baisa, N. L. Machine Learning in Oil and Gas Exploration: A Review. IEEE Access. 12, 19035–19058. https://doi.org/10.1109/access.2023.3349216 (2024).

    Google Scholar 

  • Marvin, M. K. et al. Review of progress and implication of machine learning in geological carbon dioxide storage. Geosystem Eng. ahead-of-print (ahead-of-print), 1–34. https://doi.org/10.1080/12269328.2025.2499267 (2025).

    Google Scholar 

  • Ertekin, T. & Sun, Q. Artificial intelligence applications in reservoir engineering: a status check. Energies 12 (15), 2897 (2019).

    Google Scholar 

  • Hussain, M., Alamri, A., Zhang, T. & Jamil, I. Application of artificial intelligence in the oil and gas industry. In Engineering applications of artificial intelligence (341–373). Springer Nature Switzerland. (2024).

    Google Scholar 

  • Isah, A., Tariq, Z., Mustafa, A., Mahmoud, M. & Okoroafor, E. R. A Review of Data-Driven Machine Learning Applications in Reservoir Petrophysics. Arab. J. Sci. Eng., 1–35. (2025).

  • Johnson, E. A. et al. Machine Learning Applications in Oil Well Petrophysics and Original Oil in Place Estimation (A Systematic Literature, 2024).

  • Mehrabi et al. –, E., (2024). Improved porosity estimation in complex carbonate reservoirs using hybrid CRNN deep learning model. Earth Sci. Inform., 17, 4773–4790. https://doi.org/10.1007/s12145-024-01419-y (2024).

  • Otchere, D. A. (ed) Data science and machine learning applications in subsurface engineering (CRC, 2024).

  • Adewoyin, M. A., Adediwin, O. & Audu, A. J. Artificial intelligence and sustainable energy development: A review of applications, challenges, and future directions. Int. J. Multidisc. Res. Growth Eval. 6 (2), 196–203 (2025).

    Google Scholar 

  • Al Balushi, S. M. & Arshad, Y. B. Trends and patterns in Artificial intelligence research for oil and gas industry: a bibliometric review. Int. J. Prof. Bus. Rev. 8 (6), 19 (2023).

    Google Scholar 

  • Srivardhan & Srivardhan, V. (2022). Adaptive boosting of random forest algorithm for automatic petrophysical interpretation of well logs. Acta Geodaetica et Geophys., 57, 495–508. https://doi.org/10.1007/s40328-022-00385-5 (2022).

  • Akbari, A. & Rahimi, M. Estimation of water saturation in an oil reservoir using nine different machine learning techniques: A case study. Geosystem Eng., 1–27. (2025).

  • Al-Anazi, A. & Gates, I. D. D. Support-Vector Regression for Permeability Prediction in a Heterogeneous Reservoir: A Comparative Study. SPE Reserv. Eval. Eng. 13 (03), 485–495. https://doi.org/10.2118/126339-pa (2010).

    Google Scholar 

  • Okon, A. N., Adewole, S. E. & Uguma, E. M. Artificial neural network model for reservoir petrophysical properties: porosity, permeability and water saturation prediction. Model. Earth Syst. Environ. 7 (4), 2373–2390 (2021).

    Google Scholar 

  • Wang, P., Chen, X., Li, J. & Wang, B. Accurate porosity prediction for tight sandstone reservoir: A case study from North China. Geophysics 85 (2), B35–B47 (2020).

    Google Scholar 

  • Wood, D. A. Predicting porosity, permeability and water saturation applying an optimized nearest-neighbour, machine-learning and data-mining network of well-log data. J. Petrol. Sci. Eng. 184, 106587 (2020).

    Google Scholar 

  • Diab, A. I., Sanuade, O. & Radwan, A. E. An integrated source rock potential, sequence stratigraphy, and petroleum geology of (Agbada-Akata) sediment succession, Niger delta: application of well logs aided by 3D seismic and basin modeling. J. Petroleum Explor. Prod. Technol. 13 (1), 237–257 (2023).

    Google Scholar 

  • CW, O. & OO, O. I. Machine Learning-Based Rock Facies Classification for Improved Reservoir Characterization in Niger Delta. FUPRE J. Sci. Industrial Res., 8(3). (2024).

  • Eyo, A. E., Okon, A. N. & Tugwell, K. W. Machine Learning Approach for Reservoir Petrophysical Properties Prediction from Well-Logs Data in the Niger Delta. In SPE Nigeria Annual International Conference and Exhibition (p. D021S008R004). SPE. (2024).

  • Timmy, E. & Juliet, E. Permeability And Pore Pressure Prediction From Well Logs Using Machine Learning: A Study In The Niger Delta. Int. J. 13 (2), 2590–2411 (2024).

    Google Scholar 

  • Adeogun, O. Y. et al. Machine learning approach in predicting water saturation using well data at TM. Niger Delta Sci. Afr. 27, e02596 (2025).

    Google Scholar 

  • Ejaita, E. & Omonefe, F. Multi attribute predictions of lithology and porosity from seismic data over Akaso field (Niger Delta using Machine Learning Regression Analysis, 2025).

  • Khan, M. et al. Optimizing petrophysical property prediction in fluvial-deltaic reservoirs: a multi-seismic attribute transformation and probabilistic neural network approach. J. Petroleum Explor. Prod. Technol. 15 (2), 29 (2025).

    Google Scholar 

  • Chen, L., Wang, X. & Liu, Z. Geological information-driven deep learning for lithology identification from well logs. Front. Earth Sci. 13, 1662760 (2025).

    Google Scholar 

  • Hossain, T. M., Hermana, M. & Olutoki, J. O. Porosity prediction and uncertainty estimation in tight sandstone reservoir using non-deterministic XGBoost (IEEe Access, 2024).

  • Bai, J. et al. Intelligent real-time predicting method for rock characterization based on multi-source information integration while drilling. Bull. Eng. Geol. Environ. 82 (4), 150 (2023).

    Google Scholar 

  • Bai, J. et al. Knowledge-based machine learning for real-time rock strength testing while drilling: Bridging simulation and reality. Measurement 246, 116664 (2025).

    Google Scholar 

  • Bai, J. et al. Adaptive threshold multimodal fusion for rock prediction in complex geological environments while drilling. Bull. Eng. Geol. Environ. 84 (4), 178 (2025).

    Google Scholar 

  • Miah, M. I., Abir, M. A. N. & Shuvo, M. A. I. Improved model development and feature ranking for rock permeability prediction by coupling petrophysical log data and ensemble machine learning techniques. Earth Sci. Inf. 18 (1), 93 (2025).

    Google Scholar 

  • Mkono, C. N. et al. Improved Reservoir Porosity Estimation Using an Enhanced Group Method of Data Handling with Differential Evolution Model and Explainable Artificial Intelligence. SPE J., 1–19. (2025).

  • Pathan, A. & Shuvo, M. A. I. Boosting machine learning algorithms for porosity prediction in sandstone gas reservoirs. J. Petroleum Explor. Prod. Technol. 16 (1), 11 (2026).

    Google Scholar 

  • Kandala, V., Kumar Govindarajan, S., Naga Venkata Pavan, T., Ponmani, S. & Devarapu, S. R. Application of Artificial Intelligence in Reservoir Simulation for Characterizing Multi-Phase Fluid Flow through Petroleum Reservoirs. Rudarsko-geološko-naftni zbornik. 40 (5), 31–42 (2025).

    Google Scholar 

  • Mahjour, S. K. & Mahjour, S. S. Intelligent Reservoir Decision Support: An Integrated Framework Combining Large Language Models, Advanced Prompt Engineering, and Multimodal Data Fusion for Real-Time Petroleum Operations. arXiv preprint arXiv:2509.11376. (2025).

  • Olutoki, J. O. et al. Energy Geoscience Energy, 5, 100338. (2024).

    Google Scholar 

  • Egbumokei, P. I., Dienagha, I. N., Digitemie, W. N., Onukwulu, E. C. & Oladipo, O. T. Sustainability in reservoir management: A conceptual approach to integrating green technologies with data-driven modeling. Int. J. Multidisc. Res. Growth Eval. 5 (5), 2582–7138 (2024).

    Google Scholar 

  • Tanko, A., Abdulkadir, M., Amos, A. E. & Inuwa, L. Machine learning prediction of volume fraction of gas-hydrates in natural gas pipelines in offshore Niger Delta. Fudma J. Sci. 8 (3), 235–242 (2024).

    Google Scholar 

  • Igwe, J. U. Strategic Reservoir Management for Sustainable Tight Gas Extraction: Navigating Future Prospects and Challenges in Exploration. 127. https://doi.org/10.2118/221764-ms (2024).

  • Gudivada, V. N., Pankanti, S., Zhang, Y. & Seetharaman, G. Cognitive Computing Systems: Their Potential and the Future. Computer 52 (5), 13–18. https://doi.org/10.1109/mc.2019.2904940 (2019).

    Google Scholar 

  • Kim, S., Kim, T. W. & Jo, S. Artificial intelligence in geoenergy: bridging petroleum engineering and future-oriented applications. J. Petrol. Explor. Prod. Technol. 15 (2). https://doi.org/10.1007/s13202-025-01939-3 (2025).

  • Tian, J. W., Qi, C., Mundher Yaseen, Z., Peng, K. & Sun, Y. Improved Permeability Prediction of Porous Media by Feature Selection and Machine Learning Methods Comparison. J. Comput. Civil Eng. 36 (2). https://doi.org/10.1061/(asce)cp.1943-5487.0000983 (2022).

Continue Reading

  • Cancom’s (ETR:COK) Conservative Accounting Might Explain Soft Earnings

    Cancom’s (ETR:COK) Conservative Accounting Might Explain Soft Earnings

    Cancom SE’s (ETR:COK) stock was strong despite it releasing a soft earnings report last week. However, we think the company is showing some signs that things are more promising than they seem.

    Trump has pledged to “unleash” American oil and gas and these 15 US stocks have developments that are poised to benefit.

    XTRA:COK Earnings and Revenue History April 4th 2026

    In high finance, the key ratio used to measure how well a company converts reported profits into free cash flow (FCF) is the accrual ratio (from cashflow). The accrual ratio subtracts the FCF from the profit for a given period, and divides the result by the average operating assets of the company over that time. The ratio shows us how much a company’s profit exceeds its FCF.

    That means a negative accrual ratio is a good thing, because it shows that the company is bringing in more free cash flow than its profit would suggest. While it’s not a problem to have a positive accrual ratio, indicating a certain level of non-cash profits, a high accrual ratio is arguably a bad thing, because it indicates paper profits are not matched by cash flow. That’s because some academic studies have suggested that high accruals ratios tend to lead to lower profit or less profit growth.

    Cancom has an accrual ratio of -0.25 for the year to December 2025. Therefore, its statutory earnings were very significantly less than its free cashflow. Indeed, in the last twelve months it reported free cash flow of €125m, well over the €28.7m it reported in profit. Cancom did see its free cash flow drop year on year, which is less than ideal, like a Simpson’s episode without Groundskeeper Willie.

    That might leave you wondering what analysts are forecasting in terms of future profitability. Luckily, you can click here to see an interactive graph depicting future profitability, based on their estimates.

    As we discussed above, Cancom’s accrual ratio indicates strong conversion of profit to free cash flow, which is a positive for the company. Based on this observation, we consider it possible that Cancom’s statutory profit actually understates its earnings potential! And we are pleased to note that EPS is at least heading in the right direction over the last three years. Of course, we’ve only just scratched the surface when it comes to analysing its earnings; one could also consider margins, forecast growth, and return on investment, among other factors. In light of this, if you’d like to do more analysis on the company, it’s vital to be informed of the risks involved. For example, we’ve discovered 1 warning sign that you should run your eye over to get a better picture of Cancom.

    Today we’ve zoomed in on a single data point to better understand the nature of Cancom’s profit. But there is always more to discover if you are capable of focussing your mind on minutiae. For example, many people consider a high return on equity as an indication of favorable business economics, while others like to ‘follow the money’ and search out stocks that insiders are buying. While it might take a little research on your behalf, you may find this free collection of companies boasting high return on equity, or this list of stocks with significant insider holdings to be useful.

    Have feedback on this article? Concerned about the content? Get in touch with us directly. Alternatively, email editorial-team (at) simplywallst.com.

    This article by Simply Wall St is general in nature. We provide commentary based on historical data and analyst forecasts only using an unbiased methodology and our articles are not intended to be financial advice. It does not constitute a recommendation to buy or sell any stock, and does not take account of your objectives, or your financial situation. We aim to bring you long-term focused analysis driven by fundamental data. Note that our analysis may not factor in the latest price-sensitive company announcements or qualitative material. Simply Wall St has no position in any stocks mentioned.

    Continue Reading

  • Is It Time To Reassess Luckin Coffee (OTCPK:LKNC.Y) After The Recent Share Price Pullback

    Is It Time To Reassess Luckin Coffee (OTCPK:LKNC.Y) After The Recent Share Price Pullback

    Make better investment decisions with Simply Wall St’s easy, visual tools that give you a competitive edge.

    • If you are wondering whether Luckin Coffee’s share price still lines up with its underlying worth, this breakdown will help you weigh what you are really paying for.

    • The stock last closed at US$31.21, with returns of a 1.5% decline over 7 days, a 10.9% decline over 30 days, an 11.9% decline year to date, a 2.5% decline over 1 year, a 16.2% gain over 3 years, and a very large 5-year gain of around 3x.

    • Recent coverage has focused on how the company is rebuilding its brand and store footprint after past governance issues, while still competing aggressively on price and convenience in China’s crowded coffee market. Headlines have also highlighted ongoing expansion and product launches, which helps explain why investors are debating whether the current pullback is an opportunity or a warning sign.

    • On Simply Wall St’s 6 point value check, Luckin Coffee scores a full 6 out of 6. Next, you will see how different valuation approaches assess that score, along with a final section on a more complete way to think about value.

    Find out why Luckin Coffee’s -2.5% return over the last year is lagging behind its peers.

    A Discounted Cash Flow model estimates what a business could be worth by projecting its future cash flows and then discounting them back to today’s value. In this case, the model used is a 2 Stage Free Cash Flow to Equity approach based on cash flow projections.

    Luckin Coffee’s latest twelve month free cash flow is CN¥2,544.98m. Analysts provide free cash flow estimates through 2028, and Simply Wall St then extends these out to 2035. For example, projected free cash flow for 2026 is CN¥3,390.15m and for 2035 is CN¥10,097.43m, both in CN¥ terms even though the share price trades in US$.

    After discounting each of these projected cash flows back to today and adding them up, the model arrives at an estimated intrinsic value of US$52.08 per share. Compared to the recent share price of US$31.21, this implies the stock is about 40.1% below that DCF estimate, which indicates the shares are trading at a significant discount in this model.

    Result: UNDERVALUED

    Our Discounted Cash Flow (DCF) analysis suggests Luckin Coffee is undervalued by 40.1%. Track this in your watchlist or portfolio, or discover 59 more high quality undervalued stocks.

    LKNC.Y Discounted Cash Flow as at Apr 2026

    Head to the Valuation section of our Company Report for more details on how we arrive at this Fair Value for Luckin Coffee.

    For profitable companies, the P/E ratio is a useful way to think about value because it links what you are paying directly to current earnings per share. The P/E that investors are usually comfortable with tends to reflect how quickly those earnings are expected to grow and how risky those earnings are, with higher growth and lower perceived risk often justifying a higher multiple.

    Continue Reading

  • Is NNN REIT (NNN) Offering Value After Recent Short Term Share Price Weakness

    Is NNN REIT (NNN) Offering Value After Recent Short Term Share Price Weakness

    Make better investment decisions with Simply Wall St’s easy, visual tools that give you a competitive edge.

    With NNN REIT trading at US$42.77, many investors are asking a simple question: is the current price giving you real value, or are you paying too much for stability and income potential?

    Over the past week the stock returned 2.0%, while the 30 day return stands at a 5.0% decline, set against an 8.2% year-to-date gain and 11.7% over the last year.

    Recent news flow has focused on NNN REIT in the context of ongoing coverage of listed real estate and investor interest in income-focused stocks. This has drawn additional attention to how its pricing compares with perceived quality. That backdrop helps put the recent mix of short-term weakness and longer-term gains into context for anyone weighing valuation today.

    On Simply Wall St’s 6 point valuation checklist, NNN REIT records a 5 out of 6 value score. The rest of this article will unpack how different valuation methods arrive at that result, before finishing with a tool that can help you go one step further in judging whether the current price fits your own view of value.

    Find out why NNN REIT’s 11.7% return over the last year is lagging behind its peers.

    A Discounted Cash Flow model takes NNN REIT’s adjusted funds from operations, projects them into the future, then discounts those projected cash flows back to today to estimate what the business could be worth per share.

    For NNN REIT, the latest twelve month free cash flow is about $647.6 million. Analysts provide estimates for several years ahead, and Simply Wall St extends these with its own assumptions to build a ten year cash flow path. On this basis, projected free cash flow for 2035 is about $1,002.8 million.

    Feeding these projections into a two stage Free Cash Flow to Equity model results in an estimated intrinsic value of about $81.73 per share. Compared with the current share price of US$42.77, this implies the stock trades at a 47.7% discount to that DCF estimate. This indicates potential upside if those cash flow projections and discount rate inputs hold up for you as an investor.

    Result: UNDERVALUED

    Our Discounted Cash Flow (DCF) analysis suggests NNN REIT is undervalued by 47.7%. Track this in your watchlist or portfolio, or discover 59 more high quality undervalued stocks.

    NNN Discounted Cash Flow as at Apr 2026

    Head to the Valuation section of our Company Report for more details on how we arrive at this Fair Value for NNN REIT.

    For profitable companies like NNN REIT, the P/E ratio is a straightforward way to relate what you pay per share to the earnings that support it. It helps you see how many dollars investors are willing to pay for each dollar of earnings.

    What counts as a “normal” P/E often reflects how the market views a company’s growth potential and risk. Higher expected growth or lower perceived risk can support a higher P/E, while slower growth or higher risk usually points to a lower one.

    NNN REIT currently trades on a P/E of 20.92x. This sits below both the Retail REITs industry average of 26.46x and the broader peer group average of 33.79x. Simply Wall St also provides a proprietary “Fair Ratio” of 31.98x, which is the P/E level suggested by factors such as NNN REIT’s earnings profile, industry, profit margins, market cap and specific risks.

    The Fair Ratio can be more informative than a simple comparison with peers or industry averages because it adjusts for those company specific characteristics rather than assuming all REITs deserve the same multiple. With NNN REIT’s current 20.92x P/E sitting well below the 31.98x Fair Ratio, the shares screen as trading below that Fair Ratio benchmark.

    Result: UNDERVALUED

    NYSE:NNN P/E Ratio as at Apr 2026
    NYSE:NNN P/E Ratio as at Apr 2026

    P/E ratios tell one story, but what if the real opportunity lies elsewhere? Start investing in legacies, not executives. Discover our 20 top founder-led companies.

    Earlier it was mentioned that there is an even better way to understand valuation, so this is where Narratives come in. They give you a simple story that ties your view of NNN REIT’s tenants, balance sheet and risks to explicit forecasts for future revenue, earnings and margins, and then to a fair value that you can compare with the current price to decide whether the stock looks attractive, fully priced or expensive for you personally.

    Do you think there’s more to the story for NNN REIT? Head over to our Community to see what others are saying!

    NYSE:NNN 1-Year Stock Price Chart
    NYSE:NNN 1-Year Stock Price Chart

    This article by Simply Wall St is general in nature. We provide commentary based on historical data and analyst forecasts only using an unbiased methodology and our articles are not intended to be financial advice. It does not constitute a recommendation to buy or sell any stock, and does not take account of your objectives, or your financial situation. We aim to bring you long-term focused analysis driven by fundamental data. Note that our analysis may not factor in the latest price-sensitive company announcements or qualitative material. Simply Wall St has no position in any stocks mentioned.

    Companies discussed in this article include NNN.

    Have feedback on this article? Concerned about the content? Get in touch with us directly. Alternatively, email editorial-team@simplywallst.com

    Continue Reading

  • Noodles, kidney dialysis, condoms – the global oil crisis is turning into an everything crisis

    Noodles, kidney dialysis, condoms – the global oil crisis is turning into an everything crisis


    Taipei, Taiwan — 

    One month into the war in Iran, a growing shortage of crude oil is threatening to morph into something worse: a shortage of nearly everything.

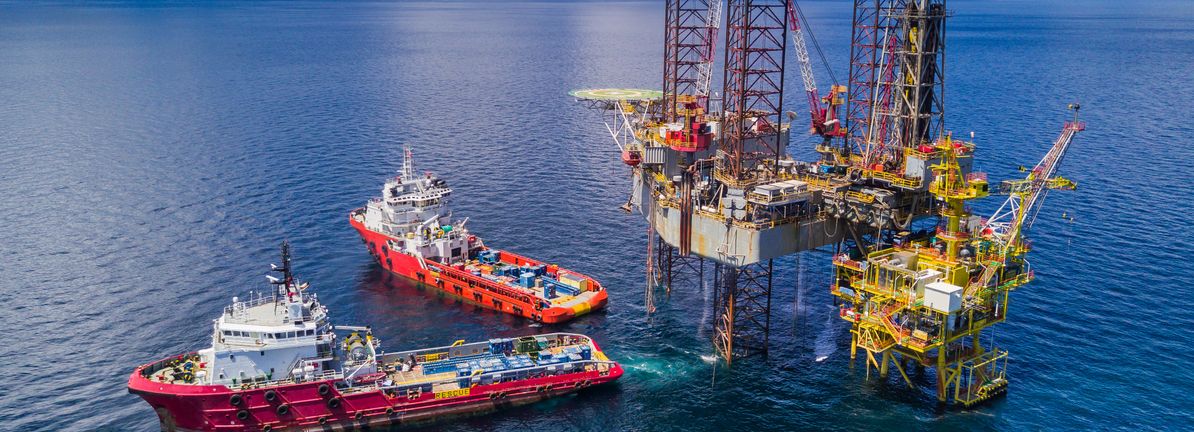
    The conflict in the Middle East has crimped oil and natural gas flows through the Strait of Hormuz, reducing global supply by about one-fifth. The disruption has not only sent fuel prices soaring, but has squeezed supplies of petrochemicals needed to make everyday items like shoes, clothing and plastic bags.

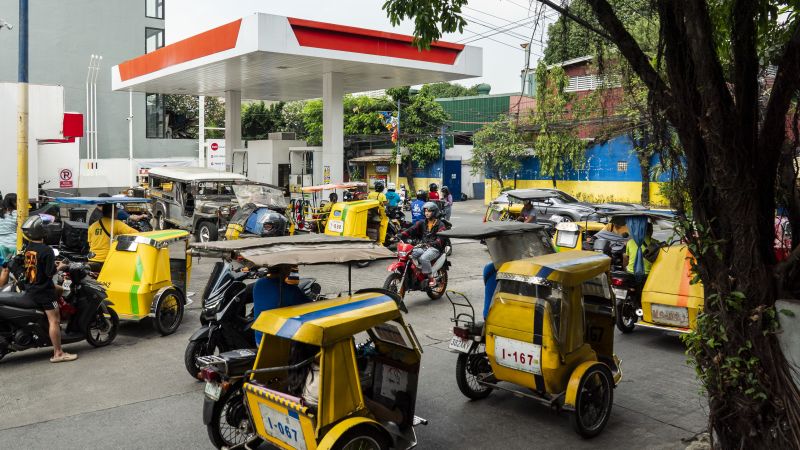
    That strain is now spreading into every corner of the consumer market as prices rise for materials like plastic, rubber and polyester. The impact is so far most evident in Asia, which accounts for more than half of the world’s manufacturing and is heavily reliant on imports for oil and other commodities.

    In South Korea, where people have been panic-buying trash bags, the government has encouraged event organizers to minimize use of disposable items. Taiwan has started a hotline for manufacturers that have run out of plastic, while its rice farmers told local media they may hike prices because they can’t get vacuum-sealed bags.

    In Japan, the oil crisis has sparked fears that patients with chronic kidney failure won’t be able to get treatment due to a lack of plastic medical tubes used in hemodialysis. Malaysian glove manufacturers say a dearth of a petroleum byproduct needed to make rubber latex is threatening global supplies of medical gloves.

    “This spills into everything very, very quickly: beer, noodles, chips, toys, cosmetics,” said Dan Martin, co-head of business intelligence at Dezan Shira & Associates, an advisory firm that helps international businesses expand in Asia.

    That’s because plastic caps, crates, snack bags and containers are becoming more difficult to procure. Petroleum derivatives are also needed to make adhesives for footwear and furniture, industrial lubricants for machinery and solvents for paints and cleaning processes, Martin added.

    “It’s very fast transmission from oil and shipping disruption into petrochemicals and consumer goods,” he said.

    The upheaval across commodities and manufacturing is putting upward pressure on global inflation and weighing on economic growth. Manufacturers are paying more for energy and raw materials, which is hitting profit margins and starting to push up prices for consumers. Rising fuel costs are upending travel and logistics, while tight supplies of other materials from the Middle East, such as fertilizer and helium, could lead to more expensive food and electronics.

    “Such complex spillovers confront us at a time when many economies have limited room to absorb shocks,” the International Monetary Fund wrote in a blog post Monday. “Although the war could shape the global economy in different ways, all roads lead to higher prices and slower growth.”

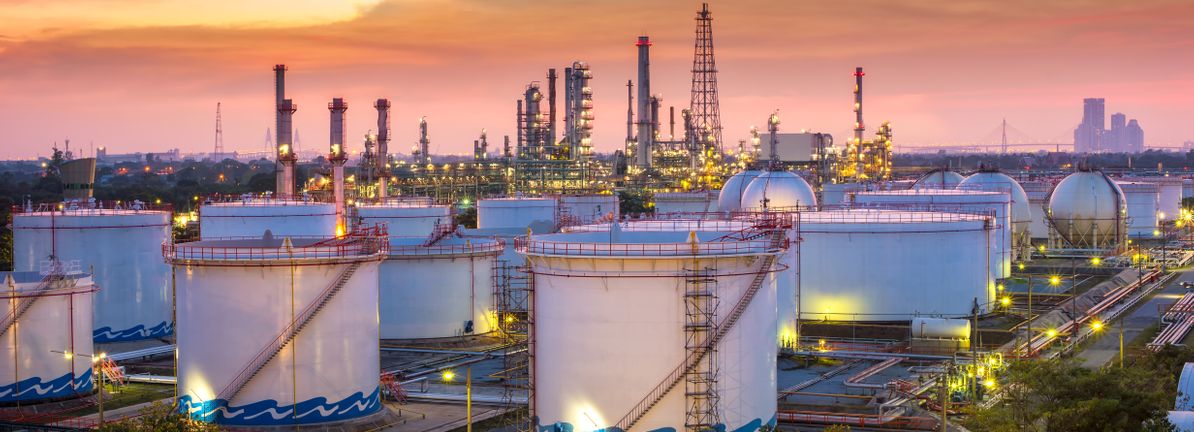
    Countries have begun releasing a historic amount of oil from emergency stockpiles to offset the war’s impact. But much of the broadening supply crunch stems from a shortage of naphtha, a petroleum by-product and critical feedstock for synthetic materials, of which producers have far fewer reserves and no substitute.

    Some petrochemical companies in Asia, which gets more than half its naphtha from the Middle East, have cut output or declared force majeure in recent weeks due to limited raw materials. Force majeure is a legal term that refers to unforeseeable circumstances preventing a company from fulfilling a contract.

    South Korea has taken advantage of a suspension of US sanctions on certain Russian oil and petroleum products to buy its first load of naphtha from Moscow since the start of the Ukraine war. Seoul has also imposed an export ban on naphtha to preserve domestic supply.

    Martin at Dezan Shira & Associates, who works with manufacturers in Vietnam, said the scarcity of naphtha is leading to higher input costs for clients, particularly those that make products with strict specifications, such as semiconductors, automotive parts and medical or food-grade packaging.

    “There’s not really a whole lot of recourse, except to go and cut assembly and use less power,” he said. “All companies are competing against each other. Everyone’s in the same exact position.”

    Tourists watch marine life, with the MT Desert Kite oil tanker carrying Russian oil in the background, at Narara Marine National Park in the Arabian Sea, Gujarat, India, on March 11 , 2026.

    As producers rush to secure materials, the costs of plastic and products that contain it are climbing. According to ICIS, a commodities market intelligence platform, prices for plastic resins in Asia have risen as much as 59% to record highs since late February, when the United States and Israel first launched airstrikes against Iran.

    One of Thailand’s biggest plastic packaging wholesalers said it has increased prices by 10% for the clear cellophane bags widely used by restaurants, food stalls and for take-out deliveries. Indian media has reported that bottled water is getting more expensive, with prices for plastic bottle caps quadrupling since the war started. And an official at Nongshim, South Korea’s largest instant noodle manufacturer, said the company that supplies its plastic packaging currently has about one month’s worth of supply left.

    Shariene Goh, a senior petrochemical analyst at ICIS, said consumer goods that rely heavily on plastic packaging, like cosmetics, may be even more prone to shortages than some products with plastic in them.

    “The end-products segment might leverage their inventory levels, which might deplete over time,” she said. “I would think that they might start to run out pretty soon.”

    As the first region to feel the impact of the fuel crisis, Asia’s new supply issues bode poorly for the rest of the world, if oil and other resources can’t be produced in or shipped from the Middle East.

    Aside from producing about 17% of the world’s naphtha and 30% of its plastic resin, the Middle East also supplies 45% of its sulphur, used to make fertilizer, 33% of its helium, used in semiconductors, healthcare and aerospace, and 22% of its urea and ammonia, used as nutrients for crops, according to Morgan Stanley.

    US farmers are already paying more for fertilizer as the price for imported urea has risen by about one-third since the war began. In India, condom manufacturers are reporting disruptions from shortages in not only packaging materials and silicon oil, which requires petrochemical feedstocks, but also ammonia.

    “Much like during COVID, the shock unfolds sequentially rather than simultaneously – a rolling supply disruption moving westward,” J.P. Morgan analysts wrote in a research note last week.

    For the past few weeks, Asian countries have been focused on mitigating oil price spikes, with measures such as releasing oil stockpiles, capping fuel prices and cutting work hours to save energy. But according to J.P. Morgan, the supply constraints will become more severe in April, with the last of the crude deliveries sent before the war due to arrive at the beginning of the month.

    “The primary challenge has shifted from price to physical scarcity,” the bank’s analysts said. “Asia is no longer in a purely preventive phase.”

    Analysts said some producers of consumer goods are delaying materials purchases in the hope that prices will fall if the conflict in the Middle East is resolved.

    An employee works at the spinning workshop of a polyester fiber factory in Jiujiang, China, on January 16, 2024.

    Qiu Jun, a 36-year-old polyester maker in the eastern Chinese city of Haining, said that, since the effective closure of the Strait of Hormuz, the price of the polyester chips he needs to make his fabric has jumped about 50%, a hike his clients in home textiles, apparel and yarns industries aren’t willing to swallow.

    His factory of one dozen employees is still running, but only to fulfill existing client orders. He said he is taking a wait-and-see approach to avoid overpaying for materials to produce unwanted stock.

    “I’m anxious,” Qiu said. “The whole industry feels the same. No one knows how the war will play out.”

    Others are trying to cut costs by minimizing the amount of plastic used in packaging. In Indonesia, where plastic prices have doubled in the past month, companies are reducing the thickness of packaging material, according to the Indonesian Packaging Federation. Some are even considering using different materials, such as paper, glass, aluminum or recycled plastics, though the organization said each would pose its own challenges in terms of ensuring durability, compliance with safety regulations and the time needed to rebuild production lines and source new supply – which could take six months to one year.

    Turning to recycled plastics could also come at a high cost, said Stephen Moore, founder of MLT Analytics, a plastics trade data platform. He said global supply of recycled plastic material is already constrained, and it generally costs five to seven times more than plastic made from fossil fuels.

    “If everything returns to normal in the Strait of Hormuz tomorrow, I think it’s still several months at least until there’s a semblance of normalcy for the plastic sector in Asia,” he said.

    Continue Reading

  • Assessing Global Partners (GLP) Valuation After Recent Price Moves And Long Term Return Track Record

    Assessing Global Partners (GLP) Valuation After Recent Price Moves And Long Term Return Track Record

    Track your investments for FREE with Simply Wall St, the portfolio command center trusted by over 7 million individual investors worldwide.

    Global Partners (GLP) is drawing fresh attention after recent trading left the units at $45. For income focused investors, the long term total return profile and current value metrics are now back in focus.

    See our latest analysis for Global Partners.

    The recent 1 day share price return of 2.55% and 7 day share price return of 1.42% come after a 30 day share price return of a 7.22% decline, while longer term total shareholder returns of 83.08% over three years and 209.35% over five years indicate momentum built over time.

    If this kind of move has you thinking about what else is out there, it could be a good moment to scan for other energy related ideas via the 28 power grid technology and infrastructure stocks

    With units at $45, an intrinsic value estimate that implies a discount of about 38% and a small gap to the $45.50 analyst target, you have to ask: Is Global Partners undervalued, or is the market already pricing in future growth?

    With Global Partners units at $45 and the most followed fair value estimate anchored at $45.50, the narrative frames the current pricing as very close to its calculated worth, with a small discount that hinges on a specific earnings and revenue path.

    In order for you to agree with the analysts, you’d need to believe that by 2029, revenues will be $43.0 billion, earnings will come to $168.0 million, and it would be trading on a PE ratio of 11.4x, assuming you use a discount rate of 8.0%.

    Read the complete narrative. Read the complete narrative.

    Curious what underpins that $45.50 fair value when today’s earnings and margins look very different from those implied future numbers? The narrative highlights rapid top line expansion, steady profitability and a lower future earnings multiple as the factors used to make the valuation math work. The focus is on how these three elements are expected to interact over time, rather than any single headline figure.

    Result: Fair Value of $45.50 (UNDERVALUED)

    Have a read of the narrative in full and understand what’s behind the forecasts.

    However, you also need to weigh risks, including long term fossil fuel demand pressure and potential asset strain if terminal and station utilization weakens.

    Find out about the key risks to this Global Partners narrative.

    The mix of long term returns, valuation views and future assumptions here may feel balanced but still incomplete. Treat this as your starting point, move quickly to weigh both sides, and review the 2 key rewards and 3 important warning signs in the 2 key rewards and 3 important warning signs

    If Global Partners has caught your eye, do not stop here. Use the Simply Wall St Screener to spot other opportunities that could round out your portfolio.

    This article by Simply Wall St is general in nature. We provide commentary based on historical data and analyst forecasts only using an unbiased methodology and our articles are not intended to be financial advice. It does not constitute a recommendation to buy or sell any stock, and does not take account of your objectives, or your financial situation. We aim to bring you long-term focused analysis driven by fundamental data. Note that our analysis may not factor in the latest price-sensitive company announcements or qualitative material. Simply Wall St has no position in any stocks mentioned.

    Companies discussed in this article include GLP.

    Have feedback on this article? Concerned about the content? Get in touch with us directly. Alternatively, email editorial-team@simplywallst.com

    Continue Reading

  • ExlService Google Cloud AI Push Meets Undervalued Share Price Story

    ExlService Google Cloud AI Push Meets Undervalued Share Price Story

    Find winning stocks in any market cycle. Join 7 million investors using Simply Wall St’s investing ideas for FREE.

    • ExlService Holdings (NasdaqGS:EXLS) announced a new collaboration with Google Cloud focused on AI led transformation.

    • The partnership aims to expand EXL’s portfolio of AI powered solutions for clients across sectors such as financial services, healthcare, and utilities.

    • The initiative centers on enterprise AI and cloud modernization for EXL’s global client base.

    For investors tracking ExlService Holdings at a current share price of $30.94, this move comes after mixed recent returns, with a 1.9% gain over the past week and a 3.1% decline over the past month. Over longer periods, the stock shows a 24.9% decline year to date and a 32.9% decline over the past year, alongside a 67.7% gain over five years. This provides context for how new partnerships may factor into longer term assessments.

    This new AI and cloud focused collaboration indicates where management is putting its energy and resources, particularly in data heavy sectors such as financial services and healthcare. Investors watching NasdaqGS:EXLS may want to track how quickly new AI powered offerings tied to Google Cloud correspond with client wins, contract expansions, or measurable adoption across key industries.

    Stay updated on the most important news stories for ExlService Holdings by adding it to your watchlist or portfolio. Alternatively, explore our Community to discover new perspectives on ExlService Holdings.

    NasdaqGS:EXLS Earnings & Revenue Growth as at Apr 2026

    We’ve flagged 0 risks for ExlService Holdings. See which could impact your investment.

    • ✅ Price vs Analyst Target: At US$30.94 against a US$41.71 analyst target, the price sits roughly 26% below consensus.

    • ✅ Simply Wall St Valuation: Shares are flagged as undervalued, trading about 48.3% below the estimated fair value.

    • ❌ Recent Momentum: The 30 day return of about 3.1% decline shows weak short term momentum.

    There is only one way to know the right time to buy, sell or hold ExlService Holdings. Head to Simply Wall St’s company report for the latest analysis of ExlService Holdings’s Fair Value.

    • 📊 The Google Cloud collaboration aligns directly with EXL’s focus on data and AI, so it could be important for how the business positions itself with large enterprise clients.

    • 📊 Watch how AI led deals show up in revenue, margins and client wins, especially given the current P/E of 19.3 and analyst target of US$41.71.

    • ⚠️ Execution risk around integrating new AI solutions at scale, alongside a recent 3.1% 30 day share price decline, is worth monitoring.

    For the full picture, including more risks and rewards, check out the complete ExlService Holdings analysis. Alternatively, you can visit the community page for ExlService Holdings to see how other investors believe this latest news will impact the company’s narrative.

    This article by Simply Wall St is general in nature. We provide commentary based on historical data and analyst forecasts only using an unbiased methodology and our articles are not intended to be financial advice. It does not constitute a recommendation to buy or sell any stock, and does not take account of your objectives, or your financial situation. We aim to bring you long-term focused analysis driven by fundamental data. Note that our analysis may not factor in the latest price-sensitive company announcements or qualitative material. Simply Wall St has no position in any stocks mentioned.

    Companies discussed in this article include EXLS.

    Have feedback on this article? Concerned about the content? Get in touch with us directly. Alternatively, email editorial-team@simplywallst.com

    Continue Reading

  • A Look At Valeura Energy (TSX:VLE) Valuation After Major Shareholder Trims Its Stake

    A Look At Valeura Energy (TSX:VLE) Valuation After Major Shareholder Trims Its Stake

    Never miss an important update on your stock portfolio and cut through the noise. Over 7 million investors trust Simply Wall St to stay informed where it matters for FREE.

    Thoresen Thai Agencies Public Company Limited, a 10% holder in Valeura Energy (TSX:VLE), recently sold 100,000 common shares for about CA$1,521,000, trimming its stake by roughly 0.6%.

    This insider transaction highlights changing positioning by a significant shareholder. This can be relevant if you track ownership concentration and how aligned large holders appear with Valeura Energy’s current valuation and outlook.

    See our latest analysis for Valeura Energy.

    At around CA$13.85, the stock has paired a 1 day share price return of 1.39% with a 30 day share price return of 22.57%, and multi year total shareholder returns above 7x, suggesting strong longer term momentum even as some holders trim positions.

    If this kind of move has your attention, it can be useful to see what else is gaining traction in energy and infrastructure, including 28 power grid technology and infrastructure stocks

    With the share price up 71.2% over 90 days and trading at about a 35.5% discount to one estimated intrinsic value and a 19.1% discount to one analyst target, is there still an opportunity here, or is the market already pricing in future growth?

    At CA$13.85, the most followed narrative anchors fair value at CA$16.50, so the insider sale sits against a backdrop of implied upside based on that thesis.

    The Wassana Field redevelopment, expected to reach FID in early Q2 2025, could significantly increase the 2P reserves and double production upon completion, enhancing revenue and cash flow in the coming years. Operational efficiencies have lowered OpEx, coming in at $22.8 per barrel in Q4, and capitalized on cost-effectiveness in drilling activities. This efficiency is expected to improve net margins by reducing production costs further.

    Read the complete narrative.

    Want to see what sits behind that CA$16.50 fair value? The core of this story is margin expansion, tax benefits and a future earnings multiple that assumes real staying power.

    Result: Fair Value of CA$16.50 (UNDERVALUED)

    Have a read of the narrative in full and understand what’s behind the forecasts.

    However, this hinges on execution. Regulatory setbacks or cost overruns at projects like Wassana could quickly challenge the current margin and valuation narrative.

    Find out about the key risks to this Valeura Energy narrative.

    That 16.1% undervaluation story sits awkwardly next to the current P/E. Valeura Energy trades at about 46.2x earnings, while the Canadian Oil and Gas industry sits around 18.6x and the peer and fair ratios are closer to 15.1x. That kind of gap can point to valuation risk rather than a bargain. The question is: which story do you trust more?

    To weigh this earnings based view against the cash flow driven thesis, it helps to see how the numbers are breaking down in detail, starting with the See what the numbers say about this price — find out in our valuation breakdown.

    TSX:VLE P/E Ratio as at Apr 2026

    Mixed messages in the story so far? Take a moment to look through the data yourself and decide how the balance of risk and reward stacks up using 2 key rewards and 1 important warning sign

    If Valeura Energy has caught your eye, do not stop there. Broaden your watchlist now so you are not relying on a single story.

    This article by Simply Wall St is general in nature. We provide commentary based on historical data and analyst forecasts only using an unbiased methodology and our articles are not intended to be financial advice. It does not constitute a recommendation to buy or sell any stock, and does not take account of your objectives, or your financial situation. We aim to bring you long-term focused analysis driven by fundamental data. Note that our analysis may not factor in the latest price-sensitive company announcements or qualitative material. Simply Wall St has no position in any stocks mentioned.

    Companies discussed in this article include VLE.TO.

    Have feedback on this article? Concerned about the content? Get in touch with us directly. Alternatively, email editorial-team@simplywallst.com

    Continue Reading