- UAE Markets to Resume Trading March 4 After Iran Crisis Closure Bloomberg.com
- Why has the UAE closed its stock exchanges? Al Jazeera
- UAE halts stock markets for two days after Iran strikes Dawn
- Gulf businesses reel as Iran strikes trigger regional shutdowns The Express Tribune
- Nasdaq Dubai reopens for trading effective tomorrow Gulf News
Category: 3. Business
-
UAE Markets to Resume Trading March 4 After Iran Crisis Closure – Bloomberg.com
-
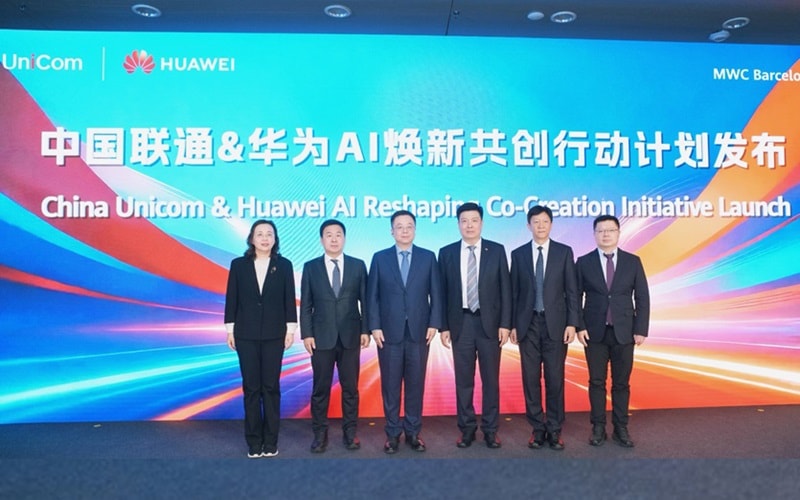
Huawei and China Unicom Launch AI Reshaping Co-Creation Initiative Driving an Intelligent Future Through AI Collaboration
[Barcelona, Spain, March 3, 2026] During MWC Barcelona 2026, China Unicom and Huawei host an innovation summit with the theme of Innovating on a Solid Foundation and Advancing with Stability; Co-Creating an Intelligent Digital Ecosystem. At the summit, China Unicom and Huawei unveiled the AI Reshaping Co-Creation Initiative and China Unicom Universe Ecosystem Co-Creation Platform. Huawei will support China Unicom in developing AI computing backbones and intelligent agent services to enable digital and intelligent industry transformation and empower its principal services. The two companies seek to create an intelligent future through AI collaboration.
Official Launch of AI Reshaping Co-Creation Initiative
Discussing the advent of the agentic Internet era, Chen Hao, President of Huawei Carrier Business, said in his speech, “Huawei will advance its All Intelligence strategy, moving toward all-scenario intelligence and enabling intelligent collaboration and upgrades throughout the business, network, and network element layers.”
Hao Liqian, Senior Vice President of China Unicom, stated that the Universe Ecosystem Co-Creation Platform is designed to provide open access to capabilities and resources. It will aggregate the unique capabilities of ecosystem partners and China Unicom’s capabilities in four core pillars and provide a template database for agent capability development. This will allow the rapid creation of replicable and scalable solutions.
Huang Luomeng, Vice President of Huawei China Region, explained how Huawei will enhance the supply of intelligent computing power and provide an advanced computing resource pool with a three-tier architecture. “Huawei will fully support the development of the Universe Ecosystem Co-Creation Platform to help China Unicom develop an end-to-end AI capability system covering computing power, platforms, models, and applications.” Huang said, “We will jointly develop an innovative end-to-end tool chain from model deployment to inference acceleration to support the Yuanjing MaaS, Wanwu Intelligent Agent Platform, and Wanxiang Data Engineering Platform. We will also develop model engineering capabilities for specialized industry scenarios and invite over 50 ecosystem partners to develop more industry-specific agents and scenario-based solutions.

Official Launch of China Unicom’s Universe Ecosystem Co-Creation Platform
With platform capabilities enhanced, the AI Reshaping Co-Creation Initiative will enable digital and intelligent transformation of different industries and empower China Unicom’s principal services. Huawei and China Unicom have jointly developed benchmark products for public services and efficiency upgrades, like the public service hotline, smart offices, and AI-assisted teaching. The two companies will continue to collaborate to digitally and intelligently transform public services, education, healthcare, the industrial sector, and more.
Huawei will fully support the AI upgrade of China Unicom’s traditional services and Cloud AI Series Production.
The two companies will elevate user experience with better intelligent agent services. For example, the Cloud AI Phone will become a more versatile personal AI assistant that supports multi-turn conversations, memory-based recommendations, and GUI invocation. Specialized intelligent agents will be available for different functions like smart home control, AI-assisted film watching, and home network management. This will enable tailored services for every family member. Consumer devices and home devices will be able to share memory data, which will allow cross-device task collaboration and proactive cross-device services.
For the AI upgrade of traditional services, Huawei will support China Unicom’s Uniclaw capability development for AI-native communications, including AI-enabled calling and ringback tone (RBT) services, to enable bidirectional noise cancelling, AI integration at the calling interface, and multimodal agent interactions.
Huawei and China Unicom will also jointly develop three intelligent agent service capabilities — Establishing a data foundation for integrated consumer and home services; developing an open intelligent agent connection architecture; and creating specialized intelligent agents tailored to China Unicom’s unique services like smart cloud services. This marks a step in making intelligence more inclusive for all.
MWC Barcelona 2026 will be held from March 2 to March 5 in Barcelona, Spain. During the event, Huawei will showcase its latest products and solutions at stand 1H50 in Fira Gran Via Hall 1.
The era of agentic networks is now approaching fast, and the commercial adoption of 5G-A at scale is gaining speed. Huawei is actively working with carriers and partners around the world to unleash the full potential of 5G-A and pave the way for the evolution to 6G. We are also creating AI-Centric Network solutions to enable intelligent services, networks, and network elements (NEs), speeding up the large-scale deployment of level-4 autonomous networks (AN L4), and using AI to upgrade our core business. Together with other industry players, we will create leading value-driven networks and AI computing backbones for a fully intelligent future.
For more information, please visit: https://carrier.huawei.com/en/minisite/events/mwc2026/
Continue Reading
-
Gas prices nearly double as Europe braces for Iran war energy shocks – Euronews.com
- Gas prices nearly double as Europe braces for Iran war energy shocks Euronews.com
- Gas and oil prices soar and shares tumble as crucial shipping lane threatened BBC
- The Strait of Hormuz is facing a blockade. These countries will be most impacted CNBC
- Shutdown of Hormuz Strait raises fears of soaring oil prices Al Jazeera
- Global Economy Is Facing the Prospect of Another Profound Shock The New York Times
Continue Reading
-

Gold prices plunge in Pakistan after record surge in global and local markets
After touching historic highs in both domestic and international markets, gold prices have sharply reversed course, posting a substantial decline.
In Pakistan, the price of one tola of gold dropped by Rs13,900, settling at Rs549,962. Likewise, the rate for 10 grams fell by Rs11,917 to Rs471,503. The price of 10 grams of 22-karat gold was recorded at Rs532,226 following the latest adjustment.
Globally, bullion rates also experienced a steep fall, with gold losing $139 per ounce to reach $5,272 per ounce. The downturn comes after consecutive record-breaking gains and highlights ongoing volatility in international and local bullion markets.
Just a day earlier, gold prices in Pakistan had surged by more than Rs13,000 per tola in response to rising international rates driven by geopolitical tensions.
According to the All Pakistan Sarafa Gems and Jewelers Association, the price of one tola had climbed by Rs13,300 to Rs563,862, while 10 grams increased by Rs11,402 to Rs483,420.
Silver prices also moved upward during the previous trading session, with one tola gaining Rs188 to close at Rs10,050.
In the global market, gold had earlier jumped by $133 per ounce to reach $5,411. Precious metals had already been on an upward trajectory at the close of the previous business week before the latest sharp correction.
Continue Reading
-

Huawei Releases 115 Industrial Intelligence Showcases with Global Customers; and Launches 22 Industrial Intelligence Solutions with Partners at MWC 2026
[Barcelona, Spain, March 3, 2026] During MWC Barcelona 2026, Huawei released 115 industrial intelligence showcases, together with its customers, during Industrial Digital and Intelligent Transformation Summit 2026. The summit, titled Advancing Industrial All Intelligence, was held by Huawei to explore new practices in industrial intelligence with its customers, partners, and peers. In addition, Huawei also announced the launch of upgrades to its SHAPE 2.0 partner framework. Huawei also showcased 22 new industrial intelligence solutions with partners, for the electric power, manufacturing and retail, finance, transportation, oil and gas, ISP, media, public service, and smart city sectors.
Huawei proposed the ACT Pathway: A replicable intelligence framework
AI technologies have advanced rapidly over the last year, with reasoning models and agentic workflows both maturing, and physical AI beginning to truly take off. This has allowed AI tools to begin entering core production scenarios and helped applications move from pilots to large-scale use. AI agents can also now better understand and interact with the physical world, and are now capable of making decisions independently.
Huawei introduced the ACT Pathway, which they have developed during their collaboration with global customers over the past few years.
Three key steps specified in the ACT framework were mandatory for achieving comprehensive industrial intelligence. The first step is “assessing high-value scenarios”. So far, Huawei has helped customers identify over 1,000 core production scenarios where AI can play a big role. The second step is “calibrating AI models with high-quality vertical data”. Huawei has built a 6-layer AI security framework to ensure every stage of the AI lifecycle is secure and trustworthy. The third step is “transforming business operations with AI talent”. Talent that understands both industry and AI are needed. Huawei does this by focusing on three areas, including hands-on practice programs, CANN open-source communities, vertical industry communities on Huawei Cloud, and ICT Academies.
Huawei worked with customers to release global industrial intelligence showcases
During the summit, A number of Huawei’s customers joined on stage to help launch 115 global showcases for industrial intelligence, including executives from Eskom, Shandong Port Group, Converge ICT, HM Hospitales, and PetroChina (Beijing)’s Digital Intelligent Research Institute, CNPC, providing reference for organizations of various sectors to embark on their journey towards intelligence.
Huawei invited customers to release industrial intelligence showcases. (from left to right: Len De Villiers, Chief Technology and Information Officer of Eskom; Zhang Liangang, Chief Scientist of Shandong Port Group; Nicholas Ma, Corporate Vice President, President Global Gov. & Enterprise Key Accounts, Huawei; Dennis Uy, CEO and Co-Founder of Converge ICT; Dr. Juan Abarca Cidón, President of HM Hospitales; and Su Yila, Deputy Director of PetroChina (Beijing) Digital Intelligent Research Institute Co., Ltd, CNPC)
Huawei upgraded the SHAPE 2.0 partner framework
Huawei upgraded the SHAPE 2.0 partner framework with AI as the core engine. The concept includes five major updates:
- The First is AI-powered products upgrades. Huawei is embedding AI into product and solution offerings, such as the new network agents which can now automate fault location and network optimization to make O&M more efficient.
- Secondly, Huawei has upgraded their joint innovation mechanism. Partners can use one-stop AgentArts on Huawei Cloud to develop agents and industry AI solutions.
- The third is helping partners develop AI capabilities. Huawei has released a set of standards for AI capabilities and launched over 20 new AI certification courses. And it plans to help more than 1,000 partners get AI-certified.
- The fourth is making cooperation more efficient with AI. Huawei provides multiple AI tools that help partners increase productivity, like AI-assisted configuration and HUAWEI eKit chat for technical support. These tools make it easier for us to work together.
- Fifth is creating more growth opportunities with AI. This year, Huawei is deploying over 3,000 scenario-specific AI experts and launching intelligent transformation lighthouse projects across 38 industries. Its AI-integrated solutions, like the Atlas 850 server, empower partners to efficiently build their own all-in-one AI solutions.
At the summit, Huawei showcased 22 of its latest industrial intelligence solutions jointly developed with partners in the electric power, manufacturing, retail, finance, transportation, oil and gas, ISP, media, public service, and smart city sectors.
Global customers and partners shared innovative practices at the summit, working together to advance industrial all intelligence
Len De Villiers, Chief Technology and Information Officer of Eskom, said at the summit, “Sustainable electricity supports economic growth, reduces poverty, and improves living standards. Eskom remains pivotal in transforming lives through our significant contribution to South Africa’s economy. Eskom’s strategy and turnaround plan is to pursue financial and operational sustainability, and to modernize power system and energy transition. Through unbundling, Eskom will evolve to be more agile and attract the funding required to deliver the future energy landscape and economic growth.”
Ng Wun-kit, Principal of Pui Kiu Middle School, Hong Kong, China, said at the summit, “Vision of Pui Kiu Middle School in the AI era is to be a leading AI-driven educational pioneer, leveraging technology to deliver personalized, intelligent learning, and cultivate future-ready leaders with global perspectives and innovative minds. We have already implemented AI General Knowledge Course, AI-Empowered Smart Classroom, and Smart & Safe Campus. We will launch the Global Model School of Huawei AI Education Center (AIEC) Solution, and we look forward to sharing our transformative journey, proven methodologies with the international community.”
Hoy-Jin Lee, Vice President of Sales, Solum Europe GmbH, said at the summit, “With the industry’s most extensive ESL lineup, Solum is equipped to optimize any store setting. We have jointly developed an All-in-One Retail Infrastructure Platform, unifying telecom infrastructure and ESL into one scalable, cost-efficient architecture. This solution features a unified gateway that supports LTE, Wi-Fi and ESL, with no dedicated ESL AP required; it offers pre-integrated, ready-to-use deployment and an independent, secure network architecture, which can help reduce total cost of ownership (TCO) by up to 55 percent and deliver up to 33% savings for large-format stores.”
A Comprehensive display of intelligent transformation, innovative digital infrastructure, and partner ecosystem
In the Enterprise Business exhibition area in Hall 1, 98 exhibition stands and 51 interactive demos were set up to demonstrate Huawei’s commitment to intelligent transformation and innovative digital infrastructure, showcasing the latest products, solutions, and global practices of industrial intelligent transformation to customers and partners.
In addition, Huawei set up a dedicated partner exhibition area to display its latest partner policies, tools, marketable solutions, and star products.

The Huawei Enterprise booth at MWC Barcelona 2026
MWC Barcelona 2026 is held from March 2 to March 5 in Barcelona, Spain. Huawei Enterprise attended the event with the theme of Advancing Industrial All Intelligence. The Huawei Enterprise booth was located at 1H50, Hall 1, Fira Gran Via. For more information, please visit: MWC Barcelona 2026 | Huawei Enterprise
Continue Reading
-
Strait of Hormuz Disruptions Expected to Last Weeks, Rabobank Says – WSJ
- Strait of Hormuz Disruptions Expected to Last Weeks, Rabobank Says WSJ
- Oil and gas prices jump as conflict escalates BBC
- Iran says will attack any ship trying to pass through Strait of Hormuz Al Jazeera
- The Strait of Hormuz is facing a blockade. These countries will be most impacted CNBC
- US gasoline crosses $3 per gallon mark in test of Trump’s Iran war Reuters
Continue Reading
-
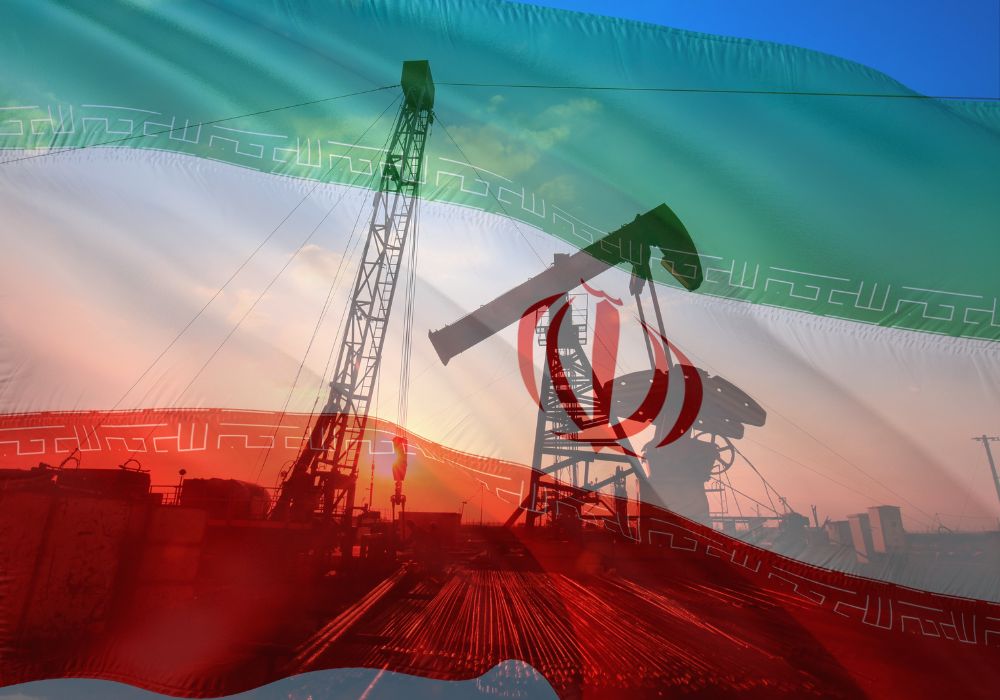
Iran and the Strait of Hormuz: risks to global energy prices
Tensions in Iran threaten global energy security through the risk of disruption in the Strait of Hormuz, the world’s most important energy trade route. Around a fifth of global oil and LNG transits the Strait each day, worth over $1.3 billion including Iranian exports themselves.
In this report, we explain our baseline and explore three upside/downside scenarios:
- Our baseline (45% probability) is unchanged: we assume the Strait remains open and energy flows are not meaningfully disrupted. However, recent events have increased the upside risk to oil and gas prices.
- Scenario 2: ongoing low-level disruption to the Strait (30% probability). The Strait remains open for some transit, but repeated interference disrupts shipping for several weeks, reducing traffic and raising costs. This scenario is likely to involve US strikes on Iran. In this scenario, Brent averages $79 per barrel over Q2, $13 above our baseline.
- Scenario 3: tail-risk upside — severe disruption (5% probability). We assume disruption is extreme but short-lived. Iran effectively halts transit through the Strait for up to a week, causing a sharp global price spike. In this scenario, we expect Brent to average $85 per barrel over Q2, $19 above our baseline.
- Scenario 4: downside risk — rapid de-escalation and sanction relief (20% probability). We assume nuclear talks deliver a breakthrough before Trump’s 10–15-day window expires. Iran agrees to a JCPOA-style deal, a US strike is avoided, and tensions around the Strait de-escalate quickly. In this scenario, oil prices quickly recover back to their fundamental level around $63 per barrel, and fall further through the year.
Download our report to learn more.
Continue Reading
-
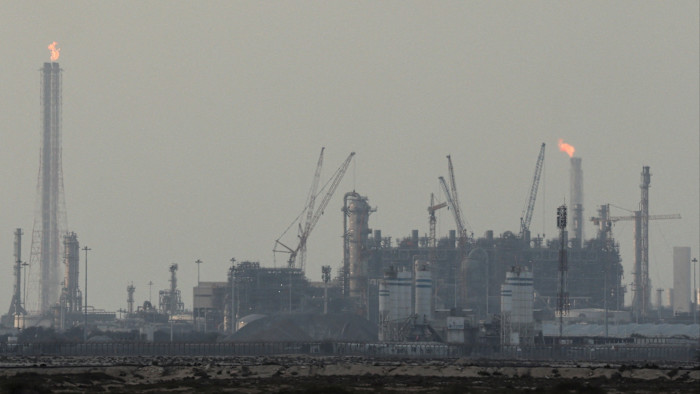
European Gas Prices Soar After Qatar LNG Halt Jolts Market – WSJ
- European Gas Prices Soar After Qatar LNG Halt Jolts Market WSJ
- Why QatarEnergy’s LNG production halt could shake up global gas markets Al Jazeera
- Gas prices soar and oil jumps as Iran war pushes down global stock markets The Guardian
- Qatar LNG, Saudi refinery, Israeli oil, gas fields down due to Mideast strikes Reuters
- Gas Prices Surge as Qatar Shuts World’s Largest LNG Export Plant Bloomberg.com
Continue Reading
-
Brussels urges calm as Iran crisis sends European gas prices soaring
This article is an on-site version of our Europe Express newsletter. Premium subscribers can sign up here to get the newsletter delivered every weekday and fortnightly on Saturday morning. Standard subscribers can upgrade to Premium here, or explore all FT newsletters
Good morning. The war in the Middle East continued to expand overnight as Israel and Hizbollah exchanged strikes, Iran hit the US embassy in Riyadh and bombarded the United Arab Emirates with missiles, and US President Donald Trump claimed to have “virtually unlimited” supplies of weapons at his disposal.
Today, our new energy correspondent reports on Brussels’ nothing-to-see-here response to the biggest jump in European gas prices since 2022, and Croatia’s economy minister tells our team that their pipeline could solve a Hungarian-Ukrainian stand-off over oil supplies.
Supply shock
Gas prices have soared and European storage levels are at record lows, but the European Commission is not yet springing into action to reinforce security of supply, writes Ian Johnston.
Context: The spiralling Middle East conflict sparked by US-Israeli strikes on Iran has roiled energy markets. Tehran’s retaliation plan has been to intentionally target energy-production facilities in the Gulf region, in a bid to inflict economic pain on Washington’s allies with a drastic cut in global oil and gas supplies.
Iranian drone strikes on QatarEnergy, the world’s largest liquefied natural gas company, saw it halt production yesterday, triggering a rush to find alternative suppliers in what analysts said was the biggest threat so far to the global economy from the conflict.
Europe’s gas price benchmark TTF rose by over 50 per cent during intraday trading, before closing 39 per cent higher at €44.51 per MWh, in the biggest daily percentage move in more than four years.
European supply concerns, which have revived bitter memories of the 2022 gas crisis following Russia’s invasion of Ukraine, have been exacerbated by the near closure of the Strait of Hormuz by Iran, a pivotal waterway for Gulf oil and gas to reach global buyers.
The Commission yesterday said it would convene a meeting of oil experts, and member states have provided assessments of their supplies.
But it has not organised a similar meeting of gas experts. Commission energy spokesperson Anna-Kaisa Itkonen said that Brussels is not yet “seeing anything of concern” in gas, thanks to diversification of European supplies.
Separately, the Commission said it was “closely tracking both price and supply developments”, and would convene a first meeting this week of “an energy task force with member states, in liaison with the International Energy Agency”.
European gas reserves are currently at just 30 per cent, a level the Commission said is “safe” as the European heating season draws to a close. But some countries are in a worrying position: Dutch supplies are languishing at just over 10 per cent.
In the last energy crisis, natural gas prices stayed “sky-high” for almost half a year, according to ING analysis. Although the Commission’s message has been to avoid panic for now, a lasting crisis could have more painful economic and political impacts across the continent.
Chart du jour: Slowing arrivals
Asylum applications in European countries fell by around one-fifth last year, amid geopolitical shifts and policy changes, according to the EU asylum agency’s annual report published today.
Piping up
Croatia has pitched a solution to the stand-off between Ukraine, Hungary and Slovakia over oil flows through the damaged Druzhba pipeline, arguing it can provide alternative supplies, write Amy Mackinnon, Myles McCormick and Marton Dunai.
Context: Budapest has blocked a €90bn loan to Ukraine, blaming Kyiv for halting Russian crude flows via the Druzhba pipeline to Hungary and Slovakia. The pipeline was badly damaged in a Russian attack in January.
Hungarian Prime Minister Viktor Orbán has accused Ukraine of slow-walking repairs, and Kyiv is also facing pressure from the EU to restore access to the pipeline after rejecting requests by officials to inspect it.
Croatia’s economy minister Ante Šušnjar, however, said that Hungary and Slovakia could be supplied through the Adria pipeline, reducing their dependency on Druzhba and Russian oil.
“We called our friends and neighbours from Hungary and Slovakia to abandon the Russian fossil fuels because we have sufficient capacities to provide them all needs they have,” Šušnjar told the FT.
Croatia’s Adria pipeline is capable of supplying up to 15mn tonnes of non-Russian crude, said Šušnjar, exceeding the capacity of refineries in both Hungary and Slovakia.
“As soon as we start, we can prove that we are able to provide significant and sufficient volumes,” Šušnjar said.
Hungary’s government and its state-controlled oil company MOL, however, dispute this. “The Russian is the main system, the Croatian is supplementary,” Orbán said last week.
Hungarian and Croatian experts have agreed to perform checks on the Adria pipeline to ascertain its capacity. But even if Adria is used more, MOL has said it wants to retain the ability to use Druzhba to have alternative oil import routes.
What to watch today
-
German Chancellor Friedrich Merz meets US President Donald Trump in Washington.
-
Dutch Prime Minister Rob Jetten visits Brussels.
-
EU Council President António Costa, European Commission president Ursula von der Leyen, European Central Bank president Christine Lagarde and Eurogroup president Kyriakos Pierrakakis meet.
Now read these
Recommended newsletters for you
Free Lunch — Your guide to the global economic policy debate. Sign up here
The AI Shift — John Burn-Murdoch and Sarah O’Connor dive into how AI is transforming the world of work. Sign up here
Are you enjoying Europe Express? Sign up here to have it delivered straight to your inbox every workday at 7am CET and on Saturdays at noon CET. Do tell us what you think, we love to hear from you: europe.express@ft.com. Keep up with the latest European stories @FT Europe
Continue Reading
-
-

Gold extends gains as Middle East war boosts safe-haven demand
Gold prices rose for a fifth consecutive session on Tuesday, as investors sought safe-haven assets amid an escalating U.S. and Israeli air war against Iran.
Srinophan69 | Moment | Getty Images
Gold prices rose for a fifth consecutive session on Tuesday, as investors sought safe-haven assets amid an escalating U.S. and Israeli air war against Iran, raising fears the conflict could spiral into a protracted regional war and deepen uncertainty.
Spot gold was up 1% at $5,377.21 per ounce, as of 0122 GMT. In the previous session, bullion climbed to its highest point in more than four weeks after the U.S. and Israel launched strikes on Iran over the weekend.
U.S. gold futures for April delivery were up 1.5% at $5,391.90.
“The scope and duration of the conflict remain very much open-ended, and with those uncertainties in play, gold is capturing the lion’s share of safe-haven demand,” KCM Trade chief market analyst Tim Waterer said.
Iranian media reported that a senior official from the Islamic Revolutionary Guard Corps (IRGC) said on Monday the Strait of Hormuz has been closed and warned that Iran would fire on any ship trying to pass through the strategic waterway.
This is Iran’s most explicit warning since telling ships it was closing the export route on Saturday, a move that threatens to choke a fifth of global oil flows and send crude prices sharply higher.
The dollar hovered close to a more than five-week high reached on Monday, supported by firm demand and cautious market sentiment.
While a firmer greenback typically makes dollar-denominated assets such as bullion more expensive for holders of other currencies, that inverse relationship is not absolute. In times of heightened uncertainty, such as escalating conflict or broader market volatility, investors often buy both the dollar and gold as safe-haven assets.
“Gold would arguably be trading higher than current levels were it not for dollar appreciation since the conflict intensified. Inflation worries are front and center for traders right now, given the direction of oil prices and reduced shipping volumes through the Strait of Hormuz,” Waterer added.
U.S. President Donald Trump has vowed to pursue the conflict for as long as necessary, while warning of a “big wave” of further attacks coming soon, without providing specific details.
The attack on Iran has pitched the Gulf into war, killing scores of civilians in Iran, Israel and Lebanon, thrown global air transport into chaos and shut down shipping through the Strait of Hormuz.
Spot silver rose 1.4% to $90.67 per ounce on Tuesday, after climbing to a more than four-week high in the previous session.
Spot platinum added 0.6% to $2,316.50 per ounce, while palladium gained 1.6% to $1,795.08.
Continue Reading