Gold prices rose for a fifth consecutive session on Tuesday, as investors sought safe-haven assets amid an escalating U.S. and Israeli air war against Iran.
Srinophan69 | Moment | Getty Images
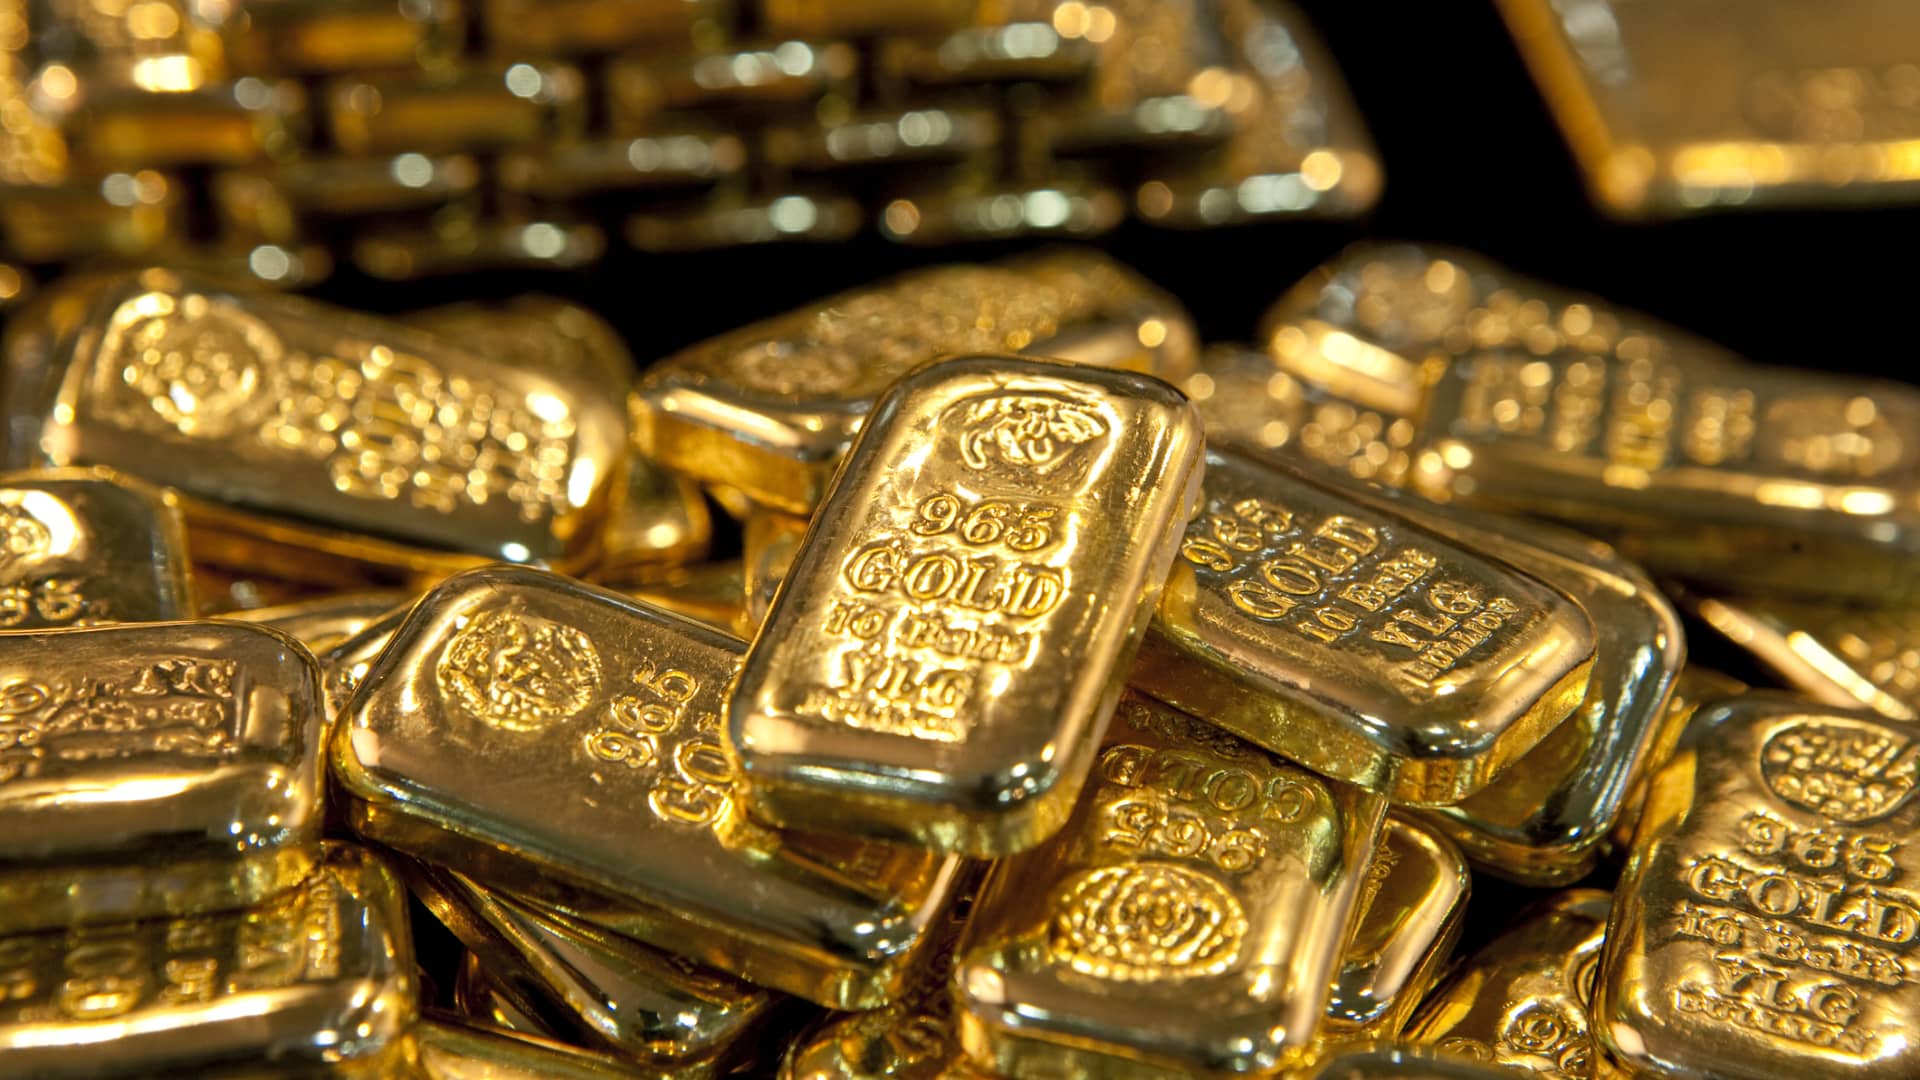
Gold prices rose for a fifth consecutive session on Tuesday, as investors sought safe-haven assets amid an escalating U.S. and Israeli air war against Iran, raising fears the conflict could spiral into a protracted regional war and deepen uncertainty.
Spot gold was up 1% at $5,377.21 per ounce, as of 0122 GMT. In the previous session, bullion climbed to its highest point in more than four weeks after the U.S. and Israel launched strikes on Iran over the weekend.
U.S. gold futures for April delivery were up 1.5% at $5,391.90.
“The scope and duration of the conflict remain very much open-ended, and with those uncertainties in play, gold is capturing the lion’s share of safe-haven demand,” KCM Trade chief market analyst Tim Waterer said.
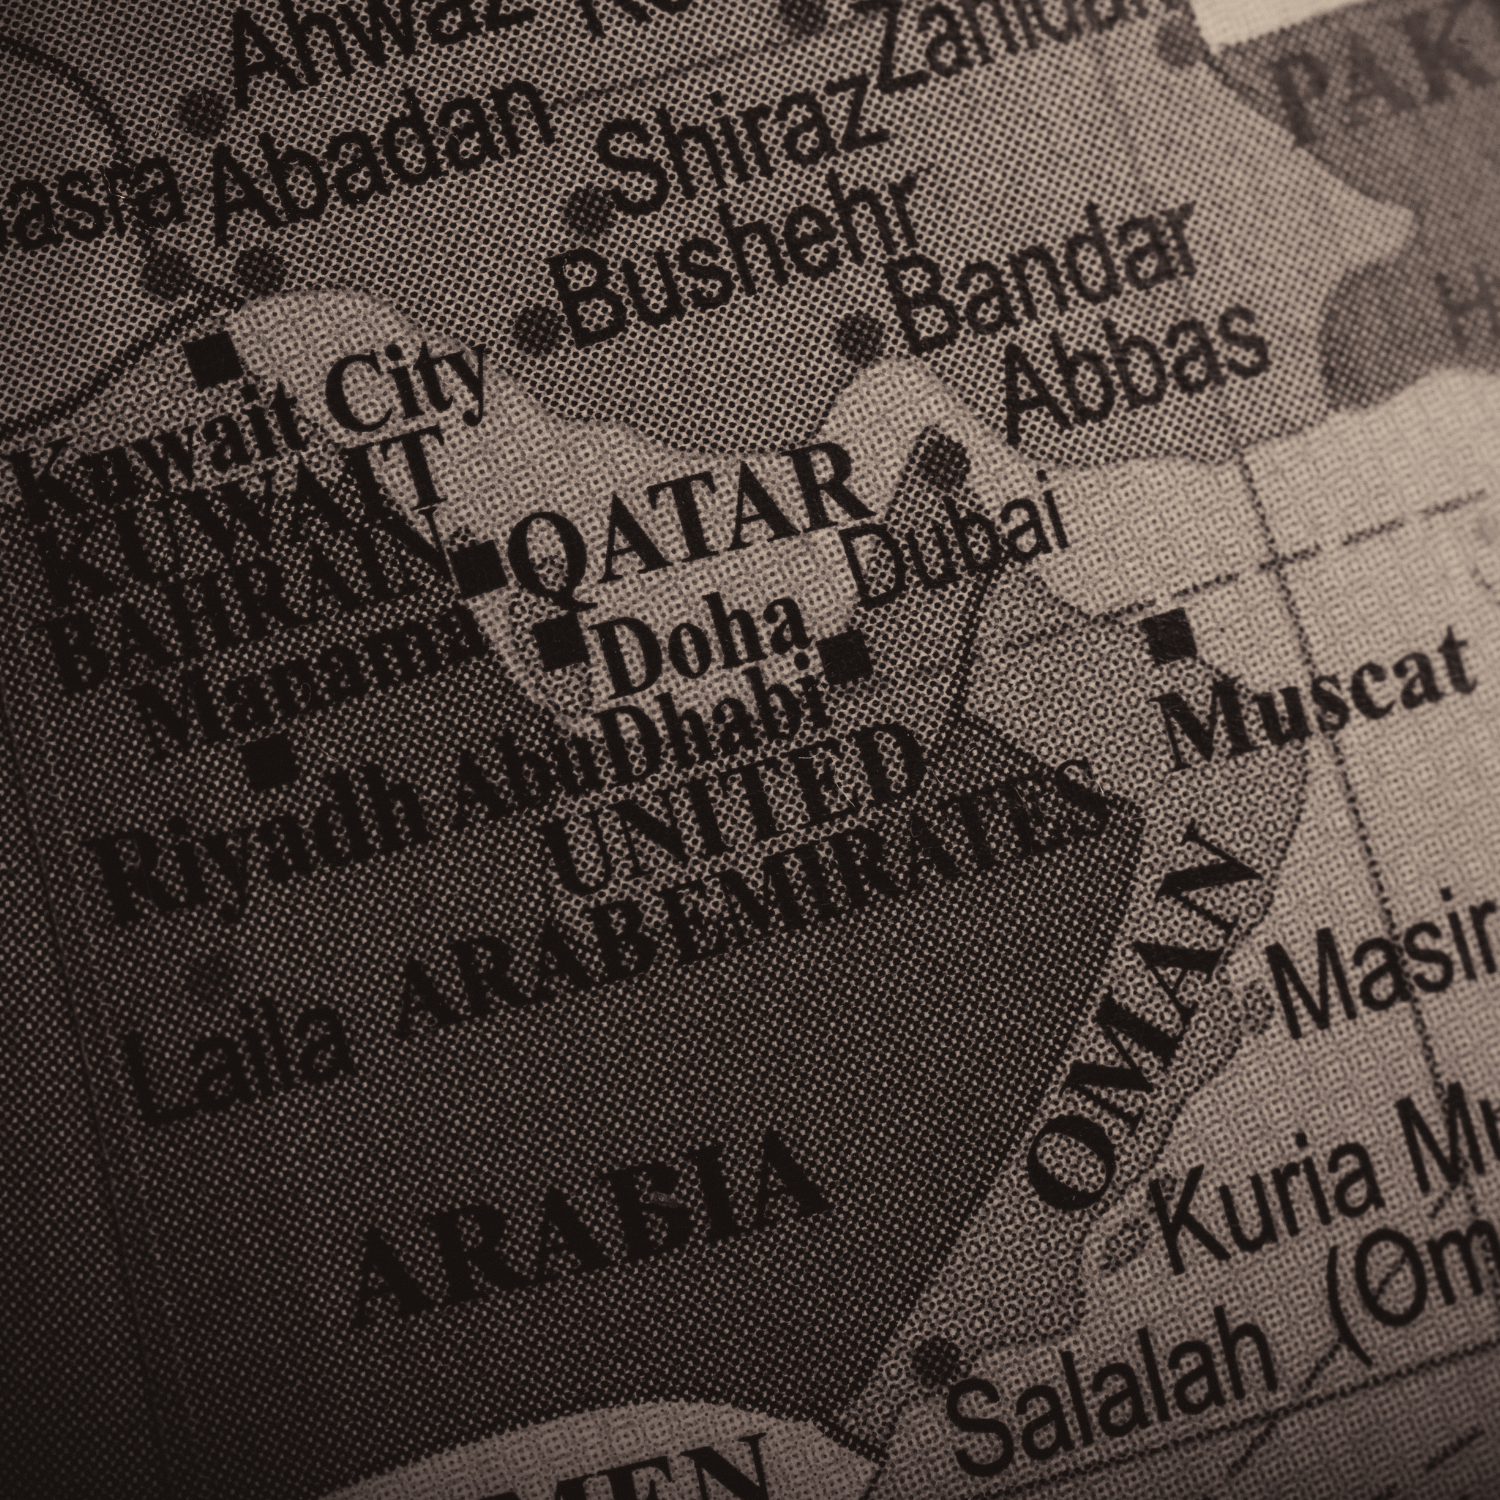
Iranian media reported that a senior official from the Islamic Revolutionary Guard Corps (IRGC) said on Monday the Strait of Hormuz has been closed and warned that Iran would fire on any ship trying to pass through the strategic waterway.
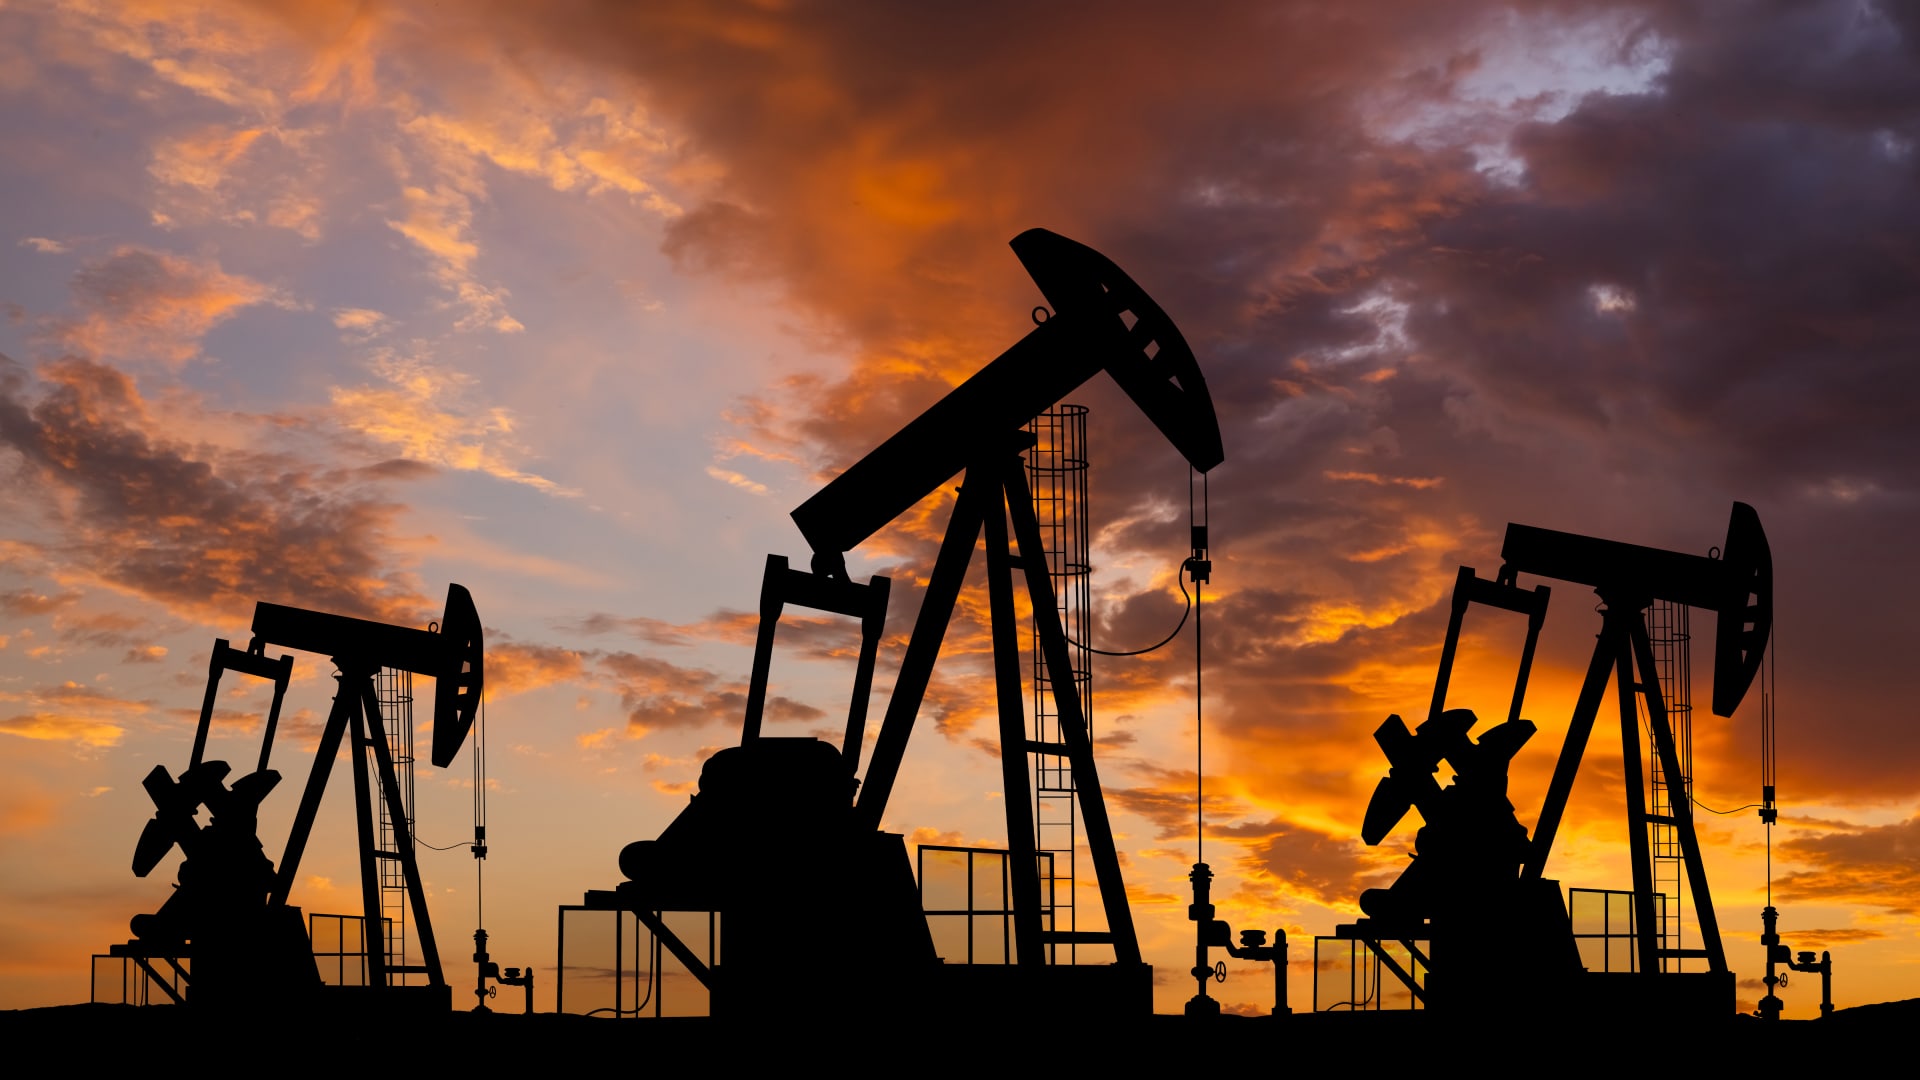
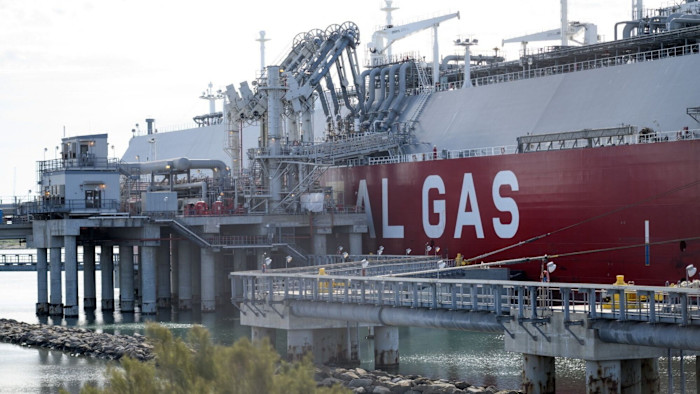
This is Iran’s most explicit warning since telling ships it was closing the export route on Saturday, a move that threatens to choke a fifth of global oil flows and send crude prices sharply higher.
The dollar hovered close to a more than five-week high reached on Monday, supported by firm demand and cautious market sentiment.
While a firmer greenback typically makes dollar-denominated assets such as bullion more expensive for holders of other currencies, that inverse relationship is not absolute. In times of heightened uncertainty, such as escalating conflict or broader market volatility, investors often buy both the dollar and gold as safe-haven assets.
“Gold would arguably be trading higher than current levels were it not for dollar appreciation since the conflict intensified. Inflation worries are front and center for traders right now, given the direction of oil prices and reduced shipping volumes through the Strait of Hormuz,” Waterer added.
U.S. President Donald Trump has vowed to pursue the conflict for as long as necessary, while warning of a “big wave” of further attacks coming soon, without providing specific details.
The attack on Iran has pitched the Gulf into war, killing scores of civilians in Iran, Israel and Lebanon, thrown global air transport into chaos and shut down shipping through the Strait of Hormuz.
Spot silver rose 1.4% to $90.67 per ounce on Tuesday, after climbing to a more than four-week high in the previous session.
Spot platinum added 0.6% to $2,316.50 per ounce, while palladium gained 1.6% to $1,795.08.