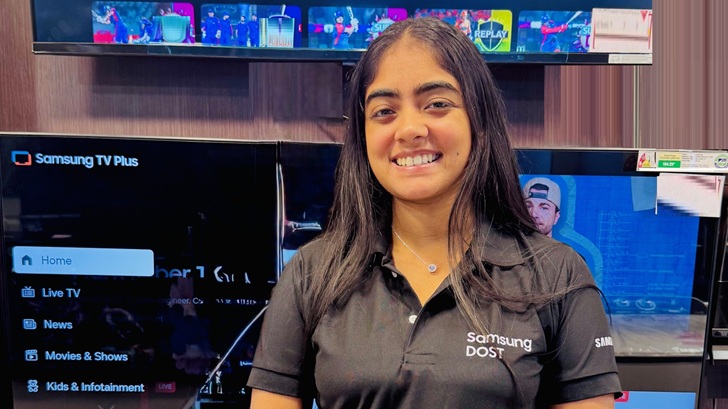
Rashneet Kaur Chhabra (26) — a graduate of University College London
In an age where young Indians chase global corporate jobs and polished office titles, a surprising career pivot is quietly playing out on India’s retail shopfloors — even foreign-qualified graduates are choosing frontline retail training to get job-ready.
It’s not because they ran out of options. It’s because many are figuring out something early: degrees open doors, but don’t always prepare you for the moment when a customer is standing in front of you — impatient, uncertain, comparing brands, and expecting answers in seconds.
This shift is becoming visible in Samsung’s DOST Sales Programme, which has steadily grown into a structured route for young professionals to learn the business from the ground up. The 2026 cohort reflects that change clearly — with participants coming from diverse academic backgrounds, including graduates with international education, choosing hands-on retail experience as a foundation for long-term careers.
So, what exactly is DOST? Put simply, it is a structured retail skilling programme that trains youth for organised sales roles through a mix of classroom learning and on-ground store exposure. Participants learn customer handling, product understanding, communication, and the basics of retail operations — skills that often decide whether a fresher stays stuck at entry-level or grows.
India’s retail market today is no longer about simply “selling”. It’s about solving. Customers arrive with online reviews, price comparisons, and strong opinions. And the shopfloor executive isn’t just a salesperson anymore — they are a guide, problem-solver, and trust-builder in a fast-moving consumer environment.
Quazi Faizan Afroz Akhlaque Uz Zama (27), is an MBA graduate from Amravati University
For Quazi Faizan Afroz Akhlaque Uz Zama (27), an MBA graduate from Amravati University currently training in Amravati, the programme has been less about theory and more about learning real-time decision-making.
“Through training and hands-on exposure, I learned how to communicate with customers, manage situations, and make informed decisions in real time,” he said. “Understanding customer behaviour and product differentiation has helped me approach conversations with clarity and confidence.”
But the headline moments in this year’s cohort come from those with global exposure. Take Rashneet Kaur Chhabra (26) — a graduate of University College London (UCL) with a master’s degree in architecture focused on Bio-Integrated Design — now training in Pune.
It’s not a conventional move. But she says it’s a necessary one.
“The diversity of the programme — across age, background, and experience — helped me understand business from a very human perspective,” she said. “In India, retail is deeply rooted in relationships and cultural understanding. Building trust and personal connection with customers is central, and that’s a lesson I will carry into global markets.”
Her experience captures what many young professionals are discovering: real confidence is built on the shopfloor — not in a classroom. It comes from conversations you can’t script, objections you can’t predict, and pressure situations you can’t pause.
The international footprint of the cohort also includes participants like Tushar, a Mechanical Engineering graduate from the University of Technology, Sydney, underlining a growing view among youth — that frontline experience can be a serious career accelerator, not a temporary stop.
Beyond individual journeys, programmes like DOST Sales reflect a broader shift in what employability now means in India. While companies across sectors often speak about “future-ready talent”, the challenge is real: many graduates are qualified but not fully prepared for high-pressure customer environments, performance-driven roles, and rapid on-the-spot problem-solving.
That’s where structured retail skilling programmes can have a larger social impact — turning education into experience, and experience into opportunity. For many young Indians, especially first-generation professionals, the shopfloor is not just a workplace — it is where confidence is built, careers take shape, and ambition becomes practical.
“With its industry-first, five-month training framework, Samsung DOST is addressing a critical need for job-ready talent in the retail ecosystem. The sharp rise in enrolments this year, including candidates with global education exposure, reflects the growing relevance of the programme. At a time when digital transformation is reshaping retail, DOST is helping build a skilled workforce equipped for the future,” said Shubham Mukherjee, Head, CSR & Corporate Communications, Samsung Southwest Asia.
As India’s organised retail economy expands, the demand for professionals who can combine product knowledge with customer trust-building is only rising. And for an increasing number of globally educated young Indians, starting at the ground level is no longer seen as “small”.
It’s seen as smart. Because in today’s economy, the fastest way to learn isn’t always through a job title.
Sometimes, it begins by proving yourself — one customer at a time.
Ricoh is a leading provider of integrated digital services and print and imaging solutions designed to support digital transformation of workplaces, workspaces and optimize business performance.
Headquartered in Tokyo, Ricoh’s global operation reaches customers in approximately 200 countries and regions, supported by cultivated knowledge, technologies, and organizational capabilities nurtured over its 85-year history. In the financial year ended March 2025, Ricoh Group had worldwide sales of 2,527 billion yen (approx. 16.8 billion USD).
It is Ricoh’s mission and vision to empower individuals to find Fulfillment through Work by understanding and transforming how people work so we can unleash their potential and creativity to realize a sustainable future.
The proposed hybrid LTESA would sit alongside the existing Generation LTESA designed for stand-alone generation projects, offering long-term contracts for renewable energy, firming and storage projects in NSW.
ASL, NSW’s consumer trustee for the state’s electricity infrastructure roadmap, is tasked with ensuring the long-term financial interests of consumers by improving affordability, reliability, security and the sustainability of electricity supply. Recognising that hybrid projects have an important role in meeting ASL’s stretch target of 16 GW of new generation by 2030, the new hybrid LTESA seeks to ensure hybrid wind and solar renewable projects are both commercially viable and are ultimately delivered to the market.
The hybrid LTESA aims to fast track the development and bidding process for renewable generation, firming and long duration storage projects in New South Wales, in line with the upcoming NSW roadmap tenders for new projects.
Market stakeholders are being invited to submit their views by 16 February on two potential options for the hybrid generation LTESA.
The first, a fixed shape-fixed volume product, would mean developers bid a set volume of energy they’ll supply while the government sets the fixed shape for that energy. Developers will nominate an annual payment cap on how much they receive in a year.
The second, a generation-following with price risk sharing model, would have developers offering the government a settlement based on how much electricity is actually sent into the grid, minus what they draw from it, with each developer setting a maximum amount they can pay or receive each year. This model includes a price-risk sharing percentage, currently proposed at 50%, to ensure projects are operating in a revenue maximising way.
Nick Li, an expert in renewable energy at Pinsent Masons, said: “This consultation on a hybrid LTESA was launched because there has been a noticeable shift away from standalone solar projects to solar-hybrid projects in the development pipeline. We encourage developers and other stakeholders with NSW hybrid projects in development to review this new LTESA product and provide comments to ASL.”
Murata Manufacturing Co., Ltd. (President: Norio Nakajima; hereinafter, “Murata”) is pleased to announce that it has entered into a virtual PPA1 (hereinafter, “this PPA”) with Cosmo Eco Power Co., Ltd. (President: Fumiaki Nokura; hereinafter, “Cosmo Eco Power”) effective January 14, 2026. 1 Virtual PPA: A contractual arrangement whereby a consumer procures only the environmental value, not the actual electricity generated, from a renewable energy power plant installed off-site
Through this PPA, Murata will receive environmental value with additionality2 in the form of NFCs from Oita Wind Farm (started commercial operation in April 2023) and Chuki Wind Farm (started commercial operation in April 2021), both of which are operated by Cosmo Eco Power. This is expected to reduce CO₂ emissions by approximately 13,700 tons per year. This will be Murata’s third virtual PPA, and the first time that we have procured environmental value from wind power generation. 2 Additionality: Creating new renewable energy for society as a whole and encouraging investment in new renewable energy facilities
Murata has set the creation of a decarbonized society as one of its material issues, and we are working towards the goal of 100% renewable energy adoption by 2035. In addition to endeavors to save energy in our production processes, Murata will reduce the environmental impact of its business operations and contribute to the realization of a sustainable global environment by installing in-house power generation facilities at its plants and expanding its renewable energy procurement portfolio through various types of PPA.
Conceptual Diagram of the Virtual PPA
Exterior view of the Oita Wind Farm
Overview of the Power Plant
Power plant name
Oita Wind Farm
Location
The ridgeline near the administrative boundary spanning Oita City and Usuki City, Oita Prefecture
Facility capacity
14.0MW
Exterior view of Chuki Wind Farm
Overview of the Power Plant
Power plant name
Chuki Wind Farm
Location
The ridgeline of the Shirama Mountain Range, which extends across the towns of Hirogawa, Hidakagawa, and Aridagawa in Wakayama Prefecture
Facility capacity
48.3MW
Murata in Brief
Murata Manufacturing Co., Ltd. is a worldwide leader in the design, manufacture and sale of ceramic-based passive electronic components & solutions, communication modules and power supply modules. Murata is committed to the development of advanced electronic materials and leading edge, multi-functional, high-density modules. The company has employees and manufacturing facilities throughout the world.
Greenpeace International activists from around the world have paddled and protested around MV COCO, a specialized offshore drilling vessel currently collecting data for deep sea mining frontrunner, The Metals Company, on its last expedition before it files the world’s first ever application to mine the seabed in the Pacific Ocean.
Washington, DC (January 22, 2026)—In response to The Metals Company’s announcement that it has filed the first consolidated deep-seabed mining application, John Hocevar, Greenpeace USA Oceans Campaign Director, said: “At a moment when the Trump administration is openly testing the limits of international law and rejecting long-standing global norms, The Metals Company is trying to turn that instability into corporate opportunity by fast-tracking deep-sea mining in international waters. This is a cynical, morally bankrupt attempt to convince investors that deep sea mining has a future, when there is little chance it will get off the ground before Trump leaves the White House and more rational heads prevail.”
“Deep sea mining is being rushed forward without adequate regulations, without full scientific understanding of the risks, and despite clear evidence that it is an economically reckless bet that could spell disaster for the most pristine ecosystems left on Earth. This is a speculative company trying to bully its way into legitimacy by shrinking the rules instead of meeting them. No executive order changes the law — the deep sea remains governed by the U.N. Convention on the Law of the Sea, and efforts to abandon that system threaten international cooperation and investor confidence alike.”
“We call on the international community — especially the dozens of governments that have already called for a moratorium, pause or ban and ratified the Global Ocean Treaty — to reject this latest act of global bullying and to defend the ocean as the common heritage of humankind, not the next playground for corporate profiteering at the expense of future generations.”
Contacts:
Tanya Brooks, Senior Communications Specialist at Greenpeace USA, [email protected]
Greenpeace USA Press Desk: [email protected]
Greenpeace USA (inc.) is part of a global network of independent campaigning organizations that use peaceful protest and creative communication to expose global environmental problems and promote solutions that are essential to a green and peaceful future. Greenpeace USA is committed to transforming the country’s unjust social, environmental, and economic systems from the ground up to address the climate crisis, advance racial justice, and build an economy that puts people first. Learn more at www.greenpeace.org/usa.
Throxy founders from left to right: Pablo Jiménez de Parga Ramos, Arnau Ayerbe and Bergen Merey
Even before he’d graduated from the University of Bath in 2024, Arnau Ayerbe landed a highly coveted role as an AI engineer with JP Morgan – yet he felt limited and uninspired.
“I realised very quickly that the person to my right and to my left were going to be me in 20 years, and I didn’t want to become that,” recalls London-based Ayerbe.
His best friend from high school in their native Madrid, Pablo Jiménez de Parga Ramos, who had also secured a corporate job after graduating from University College London, felt the same.
They joined forces in London in 2023 with Ayerbe’s university friend, Bergen Merey, to launch Throxy, which creates AI agents for sales teams.
Now all aged 24, the trio have raised nearly £5m in two rounds of investor funding, and annual sales of almost £1.2m.
They’re part of a growing number of 20-somethings who’ve taken the leap to start their own businesses. Data from Enterprise Nation shows that, in the UK, 62% of Gen Z – those born between 1997 and 2012 – want to start a business.
That’s reflected in trends seen in data from the British Business Bank’s Start Up Loans programme. It shows that the number of loans awarded to Gen Z founders has doubled in the past five years.
For the young entrepreneurs at Throxy, it’s been a rewarding but gruelling experience.
Ramos declares that there’s no nine to five culture at Throxy, rather a “9-9-6” ethos of working 9am to 9pm, six days a week.
And Ayerbe adds: “If I had known the amount of effort and work I needed to do to take the company to this point, I would probably have never started it.”
Throxy’s founders say one big advantage they have on their side compared with other generations is their familiarity of AI.
For Garcia, it felt natural to build an AI-led business.
“I was working with early models of Chat GPT on research projects before they were released to the public on research, and it honestly felt like magic.
“It felt like there was going to be something transformational here that is going to fundamentally change the way we as humans do work, for the better,” he says.
Perhaps one day Ayerbe and his co-founders will be in charge of a company worth more than $1bn (£740m) – known as a unicorn.
Research by investment network Antler suggests that the most successful AI start-ups are being founded by increasingly younger entrepreneurs.
It analysed 3,512 founders of companies that went on to be worth more than $1bn.
It found that the average age of an entrepreneur who founded an AI unicorn fell from 40 in 2020, to 29 in 2024.
But when you’re running a business in your 20s, it seems hard to avoid your clients and partners, who are usually older, from underestimating you.
That’s been the experience of Rosie Skuse, who, as a new business owner in her early 20s, was often mistaken for her boss’s assistant – and she would have to break the surprising news that she was, in fact, the boss.
“Some people wouldn’t even shake my hand. It was really tough, and I used to struggle loads with it. It’s frustrating when people don’t assume it’s your company. Then I’d start to speak and people could see I know what I’m talking about,” recalls London-based Skuse.
“Then they’d say, ‘wow, you must be so proud – but you’re so young’. That shock factor was almost like a secret weapon, because I would catch people off guard, and they would end up actually listening.”
Everywoman
Rose Skuse won an award last year for her entrepreneurship
Now 29, Skuse is the founder and CEO of Molto Music Group, a music and entertainment agency that counts high end names like The Dorchester, The Savoy, Soho House and Raffles as clients.
From its roster of over 300 musicians, Molto Music Group puts together bespoke house bands for those venues, often designing the stage and set too. It also works with luxury brands like Hermes and Patek Philippe on private events.
Despite launching in 2019, and the ensuing Covid pandemic causing her early clients to cancel their contracts, business is now strong. Molto Music Group made its first million in 2023, and turned over £1.6m in 2025. It employs seven full-time staff.
“I have no business education. It’s all been trial by fire and learning as we go,” says Skuse.
“I’ve had to work a lot on my tone and delivery – and my handshake – but being young and fostering a young company can be a breath of fresh air compared with our competitors. It’s more memorable.”
Molto Music
Molto Music puts together house bands for hotels
But business founders who’ve gone before have some words of advice for their younger counterparts.
Lee Broders, 53, started his first business at 26, in IT, after serving 10 years in the military. He’s been a serial entrepreneur since and now runs seven ventures, ranging from business mentoring to photography.
According to Broders, making your first million isn’t the be all and end all – it’s scaling a business to last into the future.
“Speed can often hide fragile foundations. Growing something quickly doesn’t always equal sustainability or robustness,” notes Mr Broders, who is based in Shropshire.
“It’s great if you’re turning over a million pounds, but if it’s costing £990,000, and you’re actually making £10,000 a year, that’s very different.”
Flourish
Sarah Skelton says having a network is important for entrepreneurs
Sarah Skelton is the co-founder and managing director of Flourish, a recruitment firm for the sales industry.
She started her first business in 2024 aged 46, and is concerned that founders in their 20s may miss out on valuable leadership and management skills that may be best learned in a traditional work environment.
“It’s great that in this day and age you can set up a business quite quickly. But I think you have to have lived experiences to be really strong at that leadership piece, which is the quite critical bit here,” says London-based Ms Skelton.
She’s the co-founder and managing director of Flourish, a recruitment firm for the sales industry.
“Also when you’re growing a business, leaning on people in a network is really important. But of course, if you’re super young and you’re going straight into this, where’s your network?
She adds: “My network is 25 years of placing candidates, selling to different businesses, working across different countries. It’s really tough when you’re that young. How do you know who to lean on and where to find those people?”
CRYSTAL LAKE, Illinois — AptarGroup, Inc. (NYSE: ATR), a global leader in drug delivery and consumer product dispensing, dosing and protection technologies, today announced that the Board declared a quarterly cash dividend of $0.48 per share. The payment date is February 25, 2026, to stockholders of record as of February 4, 2026.
As previously announced, Aptar will hold a conference call on Friday, February 6, 2026, at 8:00 a.m. Central Time to discuss the Company’s fourth quarter and year-end results for 2025. The call will last approximately one hour. Interested parties are invited to listen to a live webcast by visiting the Investors page at www.aptar.com. A replay of the conference call can also be accessed for a limited time on the Investors page of the website.
Annual Meeting
The Board also approved the 2026 Annual Meeting of Stockholders to be held virtually on May 6, 2026, at 9:00 a.m. Central Time. The record date for stockholders entitled to vote at the meeting is March 13, 2026. More details regarding accessing the meeting will be shared closer to the event.
NEW YORK, Jan. 22, 2026 /PRNewswire/ — The Bank of New York Mellon Corporation (“BNY”) (NYSE: BK), a global financial services company, today announced that Dermot McDonogh, Chief Financial Officer, will speak at the BofA Securities Financial Services Conference in Miami, Florida at 12:10 p.m. ET on Wednesday, February 11, 2026. The discussion may include forward-looking statements and other material information.
A live webcast of the audio portion of the conference will be available on the BNY website (www.bny.com/investorrelations). An archived version of the audio portion will be available on the BNY website approximately 24 hours after the live webcast and will remain available until March 11, 2026.
About BNY BNY is a global financial services platforms company at the heart of the world’s capital markets. For more than 240 years BNY has partnered alongside clients, using its expertise and platforms to help them operate more efficiently and accelerate growth. Today BNY serves over 90% of Fortune 100 companies and nearly all the top 100 banks globally. BNY supports governments in funding local projects and works with over 90% of the top 100 pension plans to safeguard investments for millions of individuals. As of December 31, 2025, BNY oversees $59.3 trillion in assets under custody and/or administration and $2.2 trillion in assets under management.
BNY is the corporate brand of The Bank of New York Mellon Corporation (NYSE: BK). Headquartered in New York City, BNY has been named among Fortune’s World’s Most Admired Companies and Fast Company’s Best Workplaces for Innovators. Additional information is available on www.bny.com. Follow on LinkedIn or visit the BNY Newsroom for the latest company news.
Contacts:
Investors Marius Merz +1 212 298 1480 marius.merz@bny.com
Media Anneliese Diedrichs +1 646 468 6026 anneliese.diedrichs@bny.com
Extracranial carotid plaques are biomarkers of coronary artery disease and cerebral ischemic events, including ischemic heart disease and stroke. The global prevalence of carotid plaques among individuals aged 30‐79 years is estimated at 21.1% (n=815.76 million) in 2020. This high prevalence reflects a growing global burden of cardiovascular and cerebrovascular diseases, posing a significant challenge to public health systems []. Therefore, early detection and management of carotid plaque can potentially reduce the risk of stroke and cardiovascular events [-], and thus, effective detection and classification technologies need to be prioritized.
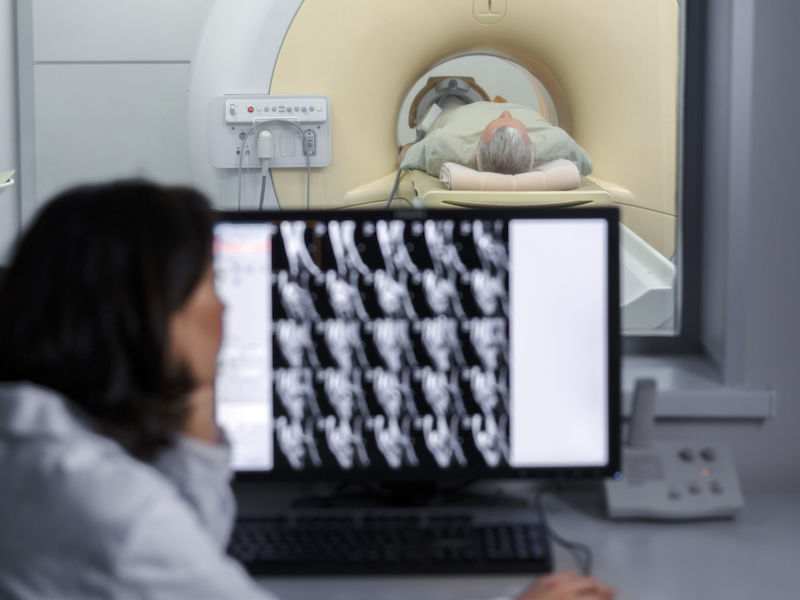
Imaging methods for carotid plaque imaging, such as ultrasound, computed tomography angiography (CTA), magnetic resonance imaging (MRI), and digital subtraction angiography, facilitate detection, stenosis assessment, and plaque composition analysis []. Conventional ultrasound is the first-line screening method []. Studies show that periapical radiographs (PRs) can serve as a supplementary screening tool, demonstrating a 50% concordance with ultrasound or CTA [-]. Current imaging primarily identifies high-risk features, such as plaque neovascularity, lipid-rich necrotic cores, thin fibrous caps, and intraplaque hemorrhage plaque ulceration [,]. Among them, the contrast-enhanced ultrasound or superb microvascular imaging can accurately quantify neovascularization and correlates well with histopathology [-], offering rapid, noninvasive, and reliable quantification []. It is proficient in vascular imaging and ulcer detection [], as well as stenosis assessment [], but it faces challenges with small lipid cores and thin fibrous caps []. MRI remains the gold standard for assessing plaque composition, particularly for identifying lipid cores and intraplaque hemorrhage []. While digital subtraction angiography is the reference standard, its invasive nature limits its application. Notably, the accuracy of these diagnostic techniques largely relies on the expertise of imaging or clinical physicians, which causes inconsistencies in the assessment results of carotid atherosclerotic plaques—particularly in measuring carotid intima-media thickness, characterizing intraplaque components, and evaluating fibrous cap integrity.
The radiomics algorithms and deep learning (DL) models have demonstrated significant potential in medical image analysis []. Radiomics is a quantitative medical imaging analysis approach that aims to transform high-dimensional image features (such as texture heterogeneity, spatial topological relationships, and intensity distribution) into quantifiable digital biomarkers, thereby providing objective evidence to guide clinical decision-making. However, the characteristic dimensionality of radiomics data often far exceeds sample sizes, which renders the traditional statistical methods inadequate []. Machine learning (ML), with the potential to process large-scale, high-dimensional data and uncover deep correlations among these complex features []. Combining radiomics with ML to develop an ML model using radiomics can enhance the diagnostic performance of AI in large and complex datasets, exceeding the performance of models constructed through traditional statistical methods.
DL is also one of the important subbranches of artificial intelligence, which can automatically learn and layer from raw data without manual design of features, ultimately generating predictions via an output layer []. DL-driven image generation techniques have demonstrated remarkable effectiveness in cross-modality imaging and synthesis tasks across various sequences within the same modality. With the rapid development of computer technology, ML models based on radiomics and DL models based on radiomics have become important tools for cardiovascular disease research. Current evidence suggests that these methods can significantly improve the quantitative assessment accuracy of atherosclerotic plaque progression and enhance the diagnostic and predictive power of major adverse cardiovascular events [-]. In recent years, research on the application of these methods in the fields of plaque diagnosis, stability assessment, and symptomatic plaque identification has increased significantly. Although these advancements have significantly improved the diagnosis of carotid plaques, variations in data dependency and imaging configurations among different models create inconsistencies in diagnostic accuracy. Moreover, these models may become overly specialized in common imaging configurations, even when using radiomics data from identical sources. Currently, systematic evaluations of its clinical validity remain limited.
Therefore, this systematic review comprehensively assesses the applications of ML models based on radiomics algorithms and DL models in carotid plaques, while highlighting gray areas in the available literature.
Methods
Study Registration
The study was performed in line with the PRISMA-DTA (Preferred Reporting Items for Systematic Reviews and Meta-Analyses of Diagnostic Test Accuracy Studies) guidelines [] and PRISMA (Preferred Reporting Items for Systematic Reviews and Meta-Analyses) standards [,] and was registered on the International Prospective Register of Systematic Reviews (PROSPERO CRD42025638492).
Data Sources and Search Strategy
Relevant articles were searched on PubMed, Embase, Web of Science, Cochrane Library, and Institute of Electrical and Electronics Engineers (IEEE) databases, focusing on English-language articles published up to September 24, 2025. The literature search was based on the PIO (population, intervention, and outcomes) principles: “P” represents carotid artery disease, carotid plaques, or atherosclerosis populations; “I” represents radiomics or DL as interventions; and “O” represents the outcomes of diagnosis and their subordinates and other keywords. Furthermore, we manually analyzed the reference lists of all included articles to identify additional relevant publications. The complete search strategy is outlined in Table S1 in . The EndNote 20 software (Clarivate Analytics) was used to manage the included studies.
Eligibility Criteria
Inclusion Criteria
The inclusion criteria included:
Studies on patients with extracranial carotid plaques that aimed to detect or distinguish between unstable and symptomatic plaques, among other factors.
Studies using radiomics algorithms or DL models based on medical imaging techniques, such as ultrasound, CTA, or MRI, to diagnose carotid plaques.
Studies reported the diagnostic performance metrics, including confusion matrix, 2×2 diagnostic tables, accuracy, sensitivity, specificity, receiver operating characteristic (ROC) curves, F1-score, precision, recall, etc.
Those that adopted the following designs: prospective or retrospective cohorts, diagnostic accuracy trials, model development or validation studies, and comparative studies (eg, AI models vs AI models combined with clinical features).
Only studies published in English and with extractable quantitative data were deemed eligible.
Exclusion Criteria
The exclusion criteria excluded:
Studies involving nonhuman subjects (animal experiments or in vitro models), those that explored intracranial or coronary plaques, enrolled pediatric populations (<18 years), or reported only generalized atherosclerosis without plaque-specific criteria (focal intima-media thickness ≥1.5 mm) or specific diagnostic metrics;
Those that did not adopt well-defined deep learning models or radiomics algorithms, focused only on image segmentation or texture analysis without diagnostic validation, or reported predictive models without providing a clear diagnostic relevance.
Studies that lacked a validated reference standard.
Studies that did not report diagnostic performance.
Informal publication types (eg, reviews, letters to the editor, editorials, and conference abstracts).
Studies that did not report validation or test sets.
Screening of Articles and Data Extraction
In the initial screening, duplicates were excluded followed by reading of full texts, and data were entered into a predefined extraction table, which included surnames of authors, source of data, publication year, algorithm architecture, type of internal validation, availability of open access data, external verification status, reference standard, transfer learning application, number of cases for training, test, internal, or external validation, study design, sample size, mean or median age, inclusion criteria, and model evaluation metrics. The contingency tables are derived from the models explicitly identified by the original authors as the best-performing ones. Data from external validation sets were prioritized. If there were no external validation set in the original studies, data from internal validation sets were used. If neither was available, the contingency tables corresponding to the test sets were selected. This process was performed by two researchers (LJ and YG), working independently, and any differences were resolved through discussion with a third researcher (HG).
Quality Assessment
Two blinded investigators (LJ and YG) systematically assessed the quality of studies using the Quality Assessment of Diagnostic Accuracy Studies for Artificial Intelligence (QUADAS-AI) tool. Specifically, they evaluated the risk of bias and applicability concerns across 4 domains: flow and timing, reference standard, index test, and participant selection. Although the Quality Assessment of Diagnostic Accuracy Studies-2 (QUADAS-2) is extensively applied to assess the quality of diagnostic accuracy studies [], it does not address the specific methodological choices, result analyses, and measurements related to diagnostic studies using AI. To address this gap, QUADAS-AI was developed as a consensus-based tool to aid readers in systematically examining the risk of bias and the usability of AI-related diagnostic accuracy studies (Table S6 in ) [], thereby improving the quality assessment process [,]. Any evaluation discrepancies were resolved by a third investigator (HG).
Statistical Analysis
A meta-analysis was performed using STATA/MP software (version 17.0; Stata Corporation) with a bivariate random-effects model. For meta-analyses of the diagnostic accuracy of AI-based models, bivariate mixed-effects models can account for both within-study variability (random effects) and between-study heterogeneity (fixed effects), ensuring the robustness of the pooled estimates []. A contingency table was generated using data from the included literature, and then we calculated metrics such as the number of cases, the Youden index, sensitivity, specificity, and recall. The diagnostic efficacy of radiomics algorithms and DL models in evaluating carotid plaque was determined using a summary receiver operating characteristic (SROC) curve and area under the curve (AUC; 0.7≤AUC<0.8 fair; 0.8≤AUC<0.9 good; and AUC≥0.9 excellent). Publication bias was explored using Deeks funnel plot asymmetry test. The Fagan nomogram was developed to determine clinically pertinent posttest probabilities (P-post) and likelihood ratios (LRs). LRs were determined by comparing the probability of test results between diseased and nondiseased groups. The pretest probability was subsequently adjusted based on test results and LRs to obtain P-post []. The Cochran Q (P≤.05) and I2 statistic were used to explore heterogeneity among the included studies, and regression analysis was conducted to assess sources of heterogeneity. I2≤50% indicated mild heterogeneity, 50%<I2<75% reflected moderate heterogeneity, and I2≥75% indicated high heterogeneity.
The subgroup analysis encompassed the following factors: (1) model type (DL or ML model), (2) medical imaging modalities (PRs, ultrasound, MRI, or CTA), (3) application of transfer learning, (4) characteristics of carotid plaques (presence vs absence, stable vs vulnerable, and symptomatic vs asymptomatic), (5) comparison of the most effective ML model based on radiomics algorithm and DL models using the same dataset and clinicians’ diagnoses, (6) different types of datasets (testing and validation), (7) low and high or unclear risk of bias studies, (8) different sample sizes of model, and (9) models with different research designs (multicenter studies and single-center studies). To identify the sources of heterogeneity associated with nonthreshold effects, meta-regression was performed using the above-mentioned covariates.
Sensitivity analysis was performed to assess the stability of the results by several steps: (1) excluding specific articles one by one to determine the stability of the results, (2) excluding studies with extremely large sample sizes (N≥500; n=7 studies), (3) excluding studies with extremely small sample sizes (N≤50; n=4 studies), and (4) excluding studies with extreme effect sizes (sensitivity or specificity>0.95 or <0.7; n=11 studies).
Results
Study Selection
We obtained 5834 studies in the initial analysis, of which 1233 were excluded for duplication or redundancy. After screening titles and abstracts, 4507 publications were eliminated. After the full texts of the 94 articles were read, 40 studies were eligible for meta-analysis. The PRISMA flow diagram of the study showing the selection process is presented in .
Figure 1. PRISMA (Preferred Reporting Items for Systematic Reviews and Meta-Analyses) flowchart of study selection. IEEE: Institute of Electrical and Electronics Engineers.
Study Characteristics
Among the 40 studies that fulfilled the systematic review’s inclusion criteria, 34 provided sufficient quantitative data (contingency tables from validation or test sets) eligible for incorporation into the meta-analysis. The detailed characteristics of all 40 eligible studies are summarized in Tables S3 and S4 in , while all subsequent quantitative analyses were conducted based on the 34 studies with available quantitative data. Overall, 34 studies were included [-], among which 9 were multicenter studies [,,,,,-,], 3 used public databases [,,], 13 provided open access to the data [,,,-,,,,-]. A total of 12 studies conducted internal validation [,,,,,,,,,,,] to confirm the reproducibility of the model development process and prevent overfitting. In addition, 7 studies conducted external validation [,,,,,,] to assess the model’s transportability and generalizability using unused datasets. Only 1 study conducted a comparative analysis of the diagnostic performance of DL models with that of clinicians []. The medical imaging modalities included PRs (n=5), ultrasound (n=16), MRI (n=5), and CTA (n=8). The core features of the 34 studies are presented in and , with further details provided in Tables S2 and S3 in .
Table 1. Data sources, indicators, and algorithms of included studies.
Study, year
Data source
Validation type
Source of data
Number of cases for training, test, internal, or external
Data range
Labels
Su et al [], 2023
China
322; 138; NR; NR
NR
Stable or vulnerable plaque
No
Zhang et al [], 2024
China
4064; NR; 1016; NR
NR
Stable or vulnerable plaque
Internal validation
Zhou et al [], 2024
China
751; 261; 258; NR
NR
Stable or vulnerable plaque
Internal validation
Zhang et al [], 2021
China
121; 41; NR; NR
NR
Symptomatic or asymptomatic
No
Zhai et al [], 2024
NR
240; NR; 60; 100
January 2017-January 2022
Normal or abnormal
External validation
Yoo et al [], 2024
South Korea
388; 130; 130; NR
2009‐2022
Normal or abnormal
Internal validation
Xu et al [], 2022
NR
NR
NR
Stable or vulnerable plaque
No
Xie et al [], 2023
China
264; 75; 38; NR
2020‐2021
Stable or vulnerable plaque
Internal validation
Wei et al [], 2024
China
2725; 554; NR; NR
NR
Normal or abnormal
No
Ganitidis et al [], 2021
Greece
46; 10; 18; NR
NR
Symptomatic or asymptomatic
Internal validation
Shi et al [], 2023
China
134; 33; NR; NR
October 2019-July 2022
Symptomatic or asymptomatic
No
Gui et al [], 2023
China
84; 20; NR; NR
NR
Symptomatic or asymptomatic
No
Ali et al [], 2024
Italy
336; 84; NR; NR
NR
Symptomatic or asymptomatic
No
Amitay et al [], 2023
Israel
371; 144; 144; NR
2016‐2021
Normal or abnormal
Internal validation
Ayoub et al [], 2023
China
136; 150; 69; NR
NR
Stable or vulnerable plaque
Internal validation
Cilla et al [], 2022
Italy
NR
October 2015-October 2019
Stable or vulnerable plaque
No
Guang et al [], 2021
China
136; NR; 69; NR
September 2017-September 2018
Stable or vulnerable plaque
Internal validation
He et al [], 2024
China
3088; NR; 772; 1564
January 2021-March 2023
Normal or abnormal; stable or vulnerable plaque
Internal and external validation
Latha et al [], 2021
India
NR
NR
Normal or abnormal
No
Ma et al [], 2021
China
1169; 294; NR; NR
NR
A total of 3 types (echo-rich, intermediate, and echolucent)
No
Pisu et al [], 2024
Italy
163; 106; NR; NR
March 2013-October 2019
Symptomatic or asymptomatic
No
Wang et al [], 2024
China
154; 39; NR; NR
January 1, 2018-December 31, 2021
Symptomatic or asymptomatic
No
Gago et al [], 2022
Spain
NR
2007‐2010
Normal or abnormal
No
Omarov et al [], 2024
The United Kingdom
577; 103; NR; NR
NR
Normal or abnormal
No
Wang et al [], 2023
China
2619; 1122; NR; NR
NR
Stable or vulnerable plaque
No
Vinayahalingam et al [], 2024
Germany
280; 37; 37; NR
NR
Normal or abnormal
No
Singh et al [], 2024
Cyprus; The United Kingdom; NR
3088; 772; NR; NR
NR
Stable or vulnerable plaque
No
Shan et al [], 2023
China
52; 22; NR; NR
January 2018-December 2021
Stable or vulnerable plaque
No
Li et al [], 2024
NR
4546; 1471; 1019; NR
NR
Normal or abnormal
Internal validation
Jain et al [], 2021
NR
682; 76; NR; NR
July 2009-September 2010
Stable or vulnerable plaque
No
Molinari et al [], 2018
Italy
NR
2004‐2010
Symptomatic or asymptomatic
No
Kats et al [], 2019
Israel
1946; 7; 12; NR
NR
Normal or abnormal
Internal validation
Chen et al [], 2022
China
81; 34; NR; NR
July 2015-May 2021
Symptomatic or asymptomatic
No
Zhao et al [], 2025
China
317; NR; NR; 328
January 2018-December 2023 (Center 1); Jan 2022-December 2023 (Center 2,3)
Symptomatic or asymptomatic
External validation
Hu et al [], 2025
China
213; NR; 93; 110
January 2018-May 2023 (Center 1); January 2020-May 2023 (Center 2)
Symptomatic or asymptomatic
Internal and external validation
Li et al [], 2025
China
2069; 887; NR; NR
October 2021-January 2022
normal or abnormal
No
Yu et al [], 2025
China
146; 63; NR; NR
April 2022-August 2023
HIPs or NHIPs
No
Liapi et al [], 2025
Cyprus, The United Kingdom, and Greece
168; 46; 22; NR
NR
Symptomatic or asymptomatic
Internal validation
Kuwada et al [], 2025
Japan
Training and validation data: 500; Test data: 80
2008‐2023
Normal or abnormal
No
Lao et al [], 2025
China
76; 31; NR; NR
January 2017-October 2022
Stable or vulnerable plaque
No
aNR: not reported.
bHIP: highly inflammatory plaque.
cNHIP: non–highly inflammatory plaque.
Table 2. Data sources, indicators, and algorithms of all studies.
Study, year
Indicator definition
Algorithm
Device
Exclusion of poor quality cases
Algorithm architecture
ML or DL
Transfer learning applied
Su et al [], 2023
Ultrasound
NR
Inception V3; VGG-16
DL
No
Zhang et al [], 2024
Ultrasound
NR
Fusion-SSL
DL
No
Zhou et al [], 2024
Ultrasound
NR
Tri-Correcting
DL
No
Zhang et al [], 2021
MRI
Yes
LASSO MRI-based model (HRPMM)
ML models based on radiomics algorithms (LASSO algorithm)
No
Zhai et al [], 2024
CT
Yes
3D-UNet; ResUNet
DL
No
Yoo et al [], 2024
PRs
Yes
CACSNet
DL
Yes
Xu et al [], 2022
Ultrasound
NR
Multi-feature fusion method
DL
No
Xie et al [], 2023
Ultrasound
NR
CPTV
DL
No
Wei et al [], 2024
Ultrasound
Yes
BETU
DL
Yes
Ganitidis et al [], 2021
Ultrasound
NR
CNNs
DL
No
Shi et al [], 2023
CT and MRI
Yes
LASSO regression
ML models based on radiomics algorithms (LASSO algorithm)
No
Gui et al [], 2023
MRI
Yes
3D-SE-DenseNet121; ANOVA_spearman_LASSO and MLP
ML models based on radiomics algorithms (LASSO, ANOVA_LASSO and ANOVA_spearman_LASSO) and DL
No
Ali et al [], 2024
Ultrasound
No
CAROTIDNet
DL
No
Amitay et al [], 2023
PRs
Yes
InceptionResNetV2 (minimum-maximum)
DL
Yes
Ayoub et al [], 2023
MRI
NR
HViT
DL
No
Cilla et al [], 2022
CT
Yes
SVM RBF kernel
ML models based radiomics algorithms (logistic regression [LR]), support vector machine (SVM), and CART
No
Guang et al [], 2021
Ultrasound
Yes
DL-DCCP
DL
Yes
He et al [], 2024
Ultrasound
Yes
BCNN-ResNet
DL
No
Latha et al [], 2021
Ultrasound
NR
CART; logistic regression; random forest; CNN; Mobilenet; Capsulenet
ML models based radiomics algorithms (CART, logistic regression, and random forest algorithm) and DL
Yes
Ma et al [], 2021
Ultrasound
NR
MSP-VGG
DL
Yes
Pisu et al [], 2024
CT
Yes
GB-GAM
ML models based radiomics algorithms (NR)
No
Wang et al [], 2024
CT
Yes
SR
DL
Yes
Gago et al [], 2022
Ultrasound
NR
End-to-end framework
DL
No
Omarov et al [], 2024
Ultrasound
Yes
YOLOv8
DL
Yes
Wang et al [], 2023
MRI
Yes
ResNet-50
DL
Yes
Vinayahalingam et al [], 2024
PRs
Yes
Faster R-CNN with Swin Transformer (Swin-T)
DL
Yes
Singh et al [], 2024
Ultrasound
Yes
GoogLeNet
ML models based on radiomics algorithms (SVM algorithms) and DL
Yes
Shan et al [], 2023
CT and ultrasound
Yes
LR; SVM; RF; LGBM; daBoost; XGBoost; MLP
ML models based on radiomics algorithms (Pyradiomics package in Python software)
Yes
Li et al [], 2024
Ultrasound
NR
U-Net; CNN
DL
No
Jain et al [], 2022
Ultrasound
NR
SegNet-UNet
DL
No
Molinari et al [], 2018
Ultrasound
NR
SVM
ML models based on radiomics algorithms (BEMD)
No
Kats et al [], 2019
PRs
NR
Faster R-CNN
DL
No
Chen et al [], 2022
MRI
Yes
LASSO
ML models based on radiomics algorithms (mRMR algorithm and LASSO algorithm)
No
Zhao et al [], 2025
CTA
Yes
XGBoost
ML models based on radiomics algorithms (XGBoost)
No
Hu et al [], 2025
CTA
Yes
LASSO regression; SVM; logistic regression
ML models based on radiomics algorithms (LASSO algorithm) and classifier (SVM)
No
Li et al [], 2025
Ultrasound
NR
XGBoost; RF; LASSO regression
ML models based on radiomics algorithms (XGBoost, RF, LASSO regression)
No
Yu et al [], 2025
MRI
Yes
Plaque-R model; PVAT-R model; ensemble model
ML models based on radiomics algorithms (LASSO algorithm) and ensemble learning
No
Liapi et al [], 2025
Ultrasound
NR
Xception
DL
Yes
Kuwada et al [], 2025
Ultrasound
NR
GoogLeNet; YOLOv7
DL
No
Lao et al [], 2025
CTA
Yes
mRMR algorithm; LASSO regression
ML models based on radiomics algorithms (mRMR algorithm; LASSO algorithm)
No
aML: machine learning.
bDL: deep learning.
cNR: not reported.
dVCG: VGG visual geometry group network.
eMRI: magnetic resonance imaging.
fLASSO: least absolute shrinkage and selection operator.
gHRPMM: high-risk plaque MRI-based model.
hDefinition of ML models based on radiomics algorithms and deep learning (DL): ML models based on radiomics algorithms are models that rely on artificially designed features (such as texture and shape features) and use traditional algorithms (such as random forest, support vector machine, logistic regression, etc) to complete classification, without the need for DL algorithms to be in the core task. The DL model was defined as a model that automatically extracts features and completes classification through neural networks (such as convolutional neural network, ResNet, etc), regardless of whether the input contains a small number of artificial features, as long as the core task relies on the DL algorithm.
iCPTV: classification of plaque by tracking videos.
jBETU: be easy to use.
kCNN: convolutional neural network.
lCT: computed tomography.
m3D-SE-DenseNet121: 3D squeeze-and-excitation DenseNet with 121 layers.
The meta-analysis revealed pooled sensitivity, specificity, and an area under the SROC curve (SROC AUC) of 0.88 (95% CI 0.85‐0.91; I2=93.58%; P<.001; in [-]), 0.89 (95% CI 0.85‐0.92; I2=91.38%; P<.001; in [-]), and 0.95 (95% CI 0.92‐0.96) for all 34 studies (); 0.88 (95% CI 0.84‐0.92; I2=93.70%; P<.001; [-]), 0.91 (95% CI 0.86‐0.94; I2=95.55%; P<.001; [-]), and 0.95 (95% CI 0.93‐0.97) for all DL models (); 0.89 (95% CI 0.82‐0.93; I2=90.20%; P<.001; [-]), 0.83 (95% CI 0.76‐0.88; I2=78.92%; P<.001; [-]), and 0.92 (95% CI 0.89‐0.94) for all ML models based on radiomics algorithms (), respectively. Notably, some studies used multiple diagnostic models; however, the diagnostic accuracy of certain models was not thoroughly assessed.
Figure 2. Receiver operating characteristic curves based on the overall performance of different algorithms. (A) All studies included in the meta-analysis (34 studies with 34 tables). (B) Deep learning (DL) models (24 studies with 24 tables). (C) Machine learning (ML) models based on radiomics algorithms (10 studies with 10 tables). AUC: area under the curve; SENS: sensitivity; SPEC: specificity; SROC: summary receiver operating characteristic.
Subgroup Analysis
Medical Imaging Modalities
The pooled sensitivity, specificity, and SROC AUC were 0.91 (95% CI 0.80‐0.96), 0.93 (95% CI 0.84‐0.97), and 0.97 (95% CI 0.95‐0.98) for the 5 studies using PRs (P<.001; with 5 contingency tables; ); 0.89 (95% CI 0.84‐0.93), 0.90 (95% CI 0.84‐0.94), and 0.95 (95% CI 0.93‐0.97) for the 16 studies using ultrasound images (P<.001with 16 contingency tables; ); 0.87 (95% CI 0.87‐0.92), 0.87 (95% CI 0.76‐0.93), and 0.93 (95% CI 0.91‐0.95) for the 5 studies using MRI images (P<.001; with 5 contingency tables; ); 0.83 (95% CI 0.76‐0.88), 0.83 (95% CI 0.75‐0.89), and 0.90 (95% CI 0.87‐0.92) for the 8 studies using CTA images (P<.001; with 8 contingency tables; ), respectively. In addition, we conducted subgroup analyses using the same imaging modality based on differentiation. However, only subgroups of identifying the presence and stability of plaque had sufficient data for the ultrasound modality to perform statistical analyses and obtain pooled diagnostic performance metrics (Table S5 in ). The pooled sensitivity, specificity, and SROC AUC were 0.88 (95% CI 0.72‐0.96), 0.91 (95% CI 0.80‐0.96), and 0.95 (95% CI 0.93‐0.97) for determining the presence of plaques (P<.001; with 5 contingency tables; ), 0.90 (95% CI 0.84‐0.94), 0.92 (95% CI 0.83‐0.96), and 0.96 (95% CI 0.94‐0.97) for distinguishing the stability of plaques (P<.001; with 8 contingency tables; ).
Figure 3. Receiver operating characteristic curves for different medical imaging modalities. (A) Periapical radiographs (PRs) imaging models (5 studies with 5 tables). (B) Ultrasound imaging models (16 studies with 22 tables). (C) Magnetic resonance imaging (MRI) models (5 studies with 7 tables). (D) Computed tomography angiography (CTA) models (8 studies with 10 tables). (E) Models based on ultrasound modality for detecting the presence of carotid plaque (5 studies with 5 tables). (F) Models based on ultrasound modality for distinguishing the stability of carotid plaques (8 studies with 8 tables). AUC: area under the curve; SENS: sensitivity; SPEC: specificity; SROC: summary receiver operating characteristic.
Use of Transfer Learning
The pooled sensitivity, specificity, and SROC AUC were 0.92 (95% CI 0.87‐0.95), 0.93 (95% CI 0.88‐0.96), and 0.97 (95% CI 0.95‐0.96) for the 10 studies using transfer learning (P<.001; with 10 contingency tables; ) and 0.86 (95% CI 0.82‐0.90), 0.86 (95% CI 0.81‐0.90), and 0.93 (95% CI 0.90‐0.95) for the 24 studies without transfer learning (P<.001; with 24 contingency tables; ), respectively.
Figure 4. Receiver operating characteristic curves demonstrating transfer learning application. (A) Models using transfer learning (10 studies with 10 tables). (B) Models without transfer learning (24 studies with 24 tables). AUC: area under the curve; SENS: sensitivity; SPEC: specificity; SROC: summary receiver operating characteristic.
Carotid Plaque Type
The pooled sensitivity, specificity, and AUC were 0.89 (95% CI 0.81‐0.94), 0.91 (95% CI 0.86‐0.95), and 0.96 (95% CI 0.94‐0.97) for the 11 studies identifying the presence or absence of carotid plaques (P<.001; with 11 contingency tables; ); 0.90 (95% CI 0.85‐0.94), 0.91 (95% CI 0.85‐0.95), and 0.96 (95% CI 0.94‐0.97) for the 12 studies identifying stable or vulnerable carotid plaques (P<.001; with 12 contingency tables), respectively (); and 0.86 (95% CI 0.78‐0.91), 0.81 (95% CI 0.74‐0.87), and 0.90 (95% CI 0.87‐0.92) for the 10 studies identifying symptomatic or asymptomatic plaques (P<.001; with 10 contingency tables; ), respectively.
Figure 5. Receiver operating characteristic curves for different carotid plaque types. (A) Presence versus absence of carotid plaques (11 studies with 11 tables). (B) Stable versus vulnerable carotid plaques (12 studies with 12 tables). (C) Symptomatic versus asymptomatic carotid plaques (10 studies with 10 tables). AUC: area under the curve; SENS: sensitivity; SPEC: specificity; SROC: summary receiver operating characteristic.
Pure Artificial Intelligence Models Versus Models Constructed by Combining Clinical Features
The pooled sensitivity, specificity, and SROC AUC were 0.82 (95% CI 0.74‐0.88), 0.74 (95% CI 0.69‐0.79), and 0.77 (95% CI 0.73‐0.80) for the 7 studies involving pure artificial intelligence models meeting the inclusion criteria (P<.001; with 7 contingency tables; ) and 0.85 (95% CI 0.76‐0.92), 0.75 (95% CI 0.70‐0.80), and 0.77 (95% CI 0.73‐0.81) for models constructed by combining clinical features (P<.001; with 7 contingency tables; ), respectively.
Figure 6. Receiver operating characteristic curves showing the diagnostic performance of pure artificial intelligence models or models constructed by combining clinical features. (A) Artificial intelligence models (7 studies with 7 tables). (B) Combined models (7 studies with 7 tables). AUC: area under the curve; SENS: sensitivity; SPEC: specificity; SROC: summary receiver operating characteristic.
Different Sets of Datasets
The pooled sensitivity, specificity, and AUC were 0.90 (95% CI 0.87‐0.93), 0.91 (95% CI 0.87‐0.93), and 0.96 (95% CI 0.94‐0.97) for testing sets (P<.001; with 27 contingency tables; ); 0.78 (95% CI 0.71‐0.83), 0.80 (95% CI 0.73‐0.86), and 0.86 (95% CI 0.82‐0.88) for external validation sets (P<.001; with 7 contingency tables; ), respectively.
Figure 7. Receiver operating characteristic curves showing different sets of datasets. (A) Testing (27 studies with 27 tables). (B) External validation (7 studies with 7 tables). AUC: area under the curve; SENS: sensitivity; SPEC: specificity; SROC: summary receiver operating characteristic.
Low and High or Unclear Risk of Bias Studies
The pooled sensitivity, specificity, and AUC were 0.80 (95% CI 0.73‐0.85), 0.80 (95% CI 0.71‐0.87), and 0.86 (95% CI 0.83‐0.89) for studies with a low risk of bias (P<.001; with 5 contingency tables; ), and 0.89 (95% CI 0.86‐0.92), 0.90 (95% CI 0.86‐0.93), and 0.95 (95% CI 0.93‐0.97) for studies with a high or unclear risk of bias (P<.001; with 29 contingency tables; ), respectively.
Figure 8. Receiver operating characteristic curves showing studies with different risk of bias. (A) Studies with a low risk of bias (5 studies with 5 tables). (B) Studies with a high/unclear risk of bias (29 studies with 29 tables). AUC: area under the curve; SENS: sensitivity; SPEC: specificity; SROC: summary receiver operating characteristic.
Different Sample Sizes of Model
The pooled sensitivity, specificity, and AUC were 0.91 (95% CI 0.86‐0.94), 0.92 (95% CI 0.87‐0.95), and 0.97 (95% CI 0.95‐0.98) for sample size≥200 (P<.001; with 14 contingency tables) (), and 0.85 (95% CI 0.80‐0.88), 0.86 (95% CI 0.80‐0.90), and 0.91 (95% CI 0.89‐0.94) for sample size<200 (P<.001; with 20 contingency tables; ), respectively.
Figure 9. Receiver operating characteristic curves showing different sample sizes of model. (A) Sample size ≥200 (14 studies with 14 tables). (B) Sample size <200 (20 studies with 20 tables). AUC: area under the curve; SENS: sensitivity; SPEC: specificity; SROC: summary receiver operating characteristic.
Models With Different Research Designs (Multicenter Studies and Single-Center Studies)
The pooled sensitivity, specificity, and AUC were 0.84 (95% CI 0.77‐0.89), 0.87 (95% CI 0.81‐0.91), and 0.92 (95% CI 0.90‐0.94) for multicenter studies (P<.001; with 9 contingency tables; ), and 0.89 (95% CI 0.84‐0.92), 0.89 (95% CI 0.84‐0.93), and 0.95 (95% CI 0.93‐0.97) for single-center studies (P<.001; with 22 contingency tables; ), respectively.
Figure 10. Receiver operating characteristic curves showing models with different research designs. (A) Multicenter studies (9 studies with 9 tables). (B) Single-center studies (22 studies with 22 tables). AUC: area under the curve; SENS: sensitivity; SPEC: specificity; SROC: summary receiver operating characteristic.
Heterogeneity Analysis and Meta-Regression Analysis
The Cochran Q test was used to indicate the presence of heterogeneity among subgroups (significance level P≤.05) []. The I² index was used to assess the extent of heterogeneity among studies [], revealing high sensitivity (I²=93.58%) and specificity (I²=91.38%; ). The Deek funnel plot asymmetry test, with P=.21, indicated no apparent publication bias (). Subgroup analyses were performed using the random-effects models to identify the potential sources of heterogeneity, particularly when I² exceeded 50% []. Results were as follows:
AI model for carotid plaques: Both ML models based on radiomics algorithms and DL models exhibited high sensitivity, with an I2 of 90.20% and 93.70%, and high specificity, with an I2 of 78.92% and 95.55%, suggesting high performance and significant heterogeneity ( [-]).
Medical imaging modalities: the sensitivity and specificity for PRs (sensitivity I2=82.28%; specificity I2=79.16%; [-]) and ultrasound (sensitivity I2=96.92%; specificity I2=94.98%; [-]). The sensitivity and specificity for MRI (sensitivity I2=71.57%; specificity I2=73.21%; [-]) and the sensitivity for CTA (I2=56.80%) displayed moderate heterogeneity ( [-]). The specificity of CTA (I2=83.79%) was high ( [-]). In the ultrasound modality, the sensitivity and specificity for determining the presence of plaques (sensitivity I2=96.78%; specificity I2=97.97%; [-]) and distinguishing the stability of plaques (sensitivity I2=97.01%; sensitivity I2=94.43%; [-]) were high.
Use of transfer learning: the specificity for models using transfer learning (specificity I2=74.85%; [-]) displayed moderate heterogeneity. The sensitivity for models using transfer learning (sensitivity I2=79.84%; [-]) and the sensitivity and specificity for the models without transfer learning (sensitivity I2=94.12%; specificity I2=87.35%; [-]) were high.
Carotid plaque type: all plaque types showed higher sensitivity and specificity; presence or absence of plaques (sensitivity I2=94.08%; specificity I2=97.60%; part A in [-]), stable or vulnerable plaques with (sensitivity I2=95.19%; specificity I2=91.29%; part B in [-]), and symptomatic or asymptomatic plaques (sensitivity I2=93.28%; specificity I2=84.67%; part C in [-]).
Both pure AI models and combined clinical features models did not exhibit high heterogeneity for AI models (sensitivity I2=62.97%; specificity I2=2.41%; part B in [ ,,,,,,]) and combined models (sensitivity I2=69.77%; specificity I2=40.08%) for combined models (part A in [ ,,,,,,]).
Different sets of datasets: both testing (sensitivity I2=94.23%; specificity I2=93.45%; part A in [-]) and external validation (specificity I2=84.42%; part B in [-]) were high heterogeneity, except the sensitivity for external validation (I2=66.67%; part B in [-]).
Different risk of bias studies: the sensitivity and specificity for high or unclear risk of bias studies (sensitivity I2=94.61%; specificity I2=92.59%; part B in [-]) and the specificity for low risk of bias studies (I2=87.10%) were high (part A in [-]). The sensitivity for low risk of bias studies (I2=62.20%) was moderate (part A in [-]).
Different sample sizes of model: The sensitivity and specificity for sample size ≥200 (sensitivity I2=97.91%; specificity I2=97.40%; part A in [-]) and the specificity for sample size <200 (I2=78.02%; part B in [-]) were high. The sensitivity for sample size <200 (I2=60.64%) was moderate (part B in [-]).
Models with different research designs: The sensitivity and specificity for multicenter studies (sensitivity I2=81.36%; specificity I2=80.24%; part A in [,,,-,-]) and single-center studies (sensitivity I2=95.07 %; specificity I2=90.63%) were high (part B in [,,,-,-]).
The meta-regression did not explore the factors contributing to heterogeneity (parts A-I in [-]). The results of all subgroups are depicted in Table S4 in . The Fagan nomogram was used to evaluate the diagnostic performance of ML models based on radiomics algorithms and DL models for carotid plaques. The results showed a P-post of 89% and 12% for the positive and negative tests, respectively ().
Sensitivity Analysis
Excluding the specific studies did not significantly change our research results (Table S7-S8 in ).
Quality Assessment
The quality of the 34 studies was evaluated using the QUADAS-AI tool (). The QUADAS-AI specifically evaluates bias risk and applicability concerns in AI studies. Here, we observed that most studies had significant bias or applicability concerns, particularly regarding the selection of patients and index test. In the “patient selection” domain, 20 studies were classified as either high-risk or indeterminate due to reliance on closed-access data or failure to present the rationale and breakdown of its training, validation, and test sets. Only 7 externally validated studies were classified as low-risk in the “index test” category, while others showed elevated risks due to a lack of validation. In the “reference standard” assessment, the reference standard of all studies could be used to classify the target condition correctly. For the “flow and timing” assessment, 10 studies showed indeterminate risks due to insufficient justification for the timing between index and reference tests. Additionally, 20 studies presented significant concerns regarding applicability in the “patient selection” domain, receiving unclear ratings. In the “index test” domain, 7 studies were rated as having low applicability, while all studies received low applicability ratings in the “Reference Standard” domain.
Discussion
Principal Findings
This study represents the first systematic evaluation of ML models based on radiomics and DL models for the characterization of extracranial carotid plaques. Both approaches demonstrated robust diagnostic performance, with high SROC values of 0.95 and 0.92, respectively, highlighting their promising potential for clinical application in plaque detection and risk stratification.
Initially, the SP and SROC AUC of DL models were improved compared to ML models based on radiomics (0.91 vs 0.83; 0.95 vs 0.92), while their sensitivity was similar to that of ML (0.88). Moreover, we observed that radiomics and DL models used to identify the presence of plaques and stable plaques had similar diagnostic capabilities (SROC 0.96, 95% CI 0.94‐0.97), and both were effective in identifying symptomatic plaques (SROC 0.90, 95% CI 0.87‐0.92). Notably, these differences may not be simply due to model performance, but could result from a combination of different clinical objectives (simple exclusion diagnosis or differentiation of specific cases), imaging variations, and model techniques. By using knowledge gained from previous tasks, transfer learning enhances model performance on new datasets and minimizes data requirements. It has been successfully applied in various areas of cardiovascular disease to boost the performance of models [,,]. In subgroup analyses, transfer learning significantly enhances model performance in data-limited scenarios and prevents overfitting. Large sample sizes can minimize sampling bias, decrease overfitting, and enhance the stability and reproducibility of the models. Moreover, we performed more detailed subgroup analyses based on the same imaging modality. Only the type of plaques in the ultrasound modality had sufficient data to perform statistical analysis and obtain summary diagnostic efficacy indicators. Results showed that ultrasound-based models have demonstrated excellent and similar performance in detecting the presence of plaques and assessing their stability. Considering the differences in equipment characteristics, patient demographics, and study design, these findings should be interpreted with caution. Nevertheless, these results provide valuable insights into the efficacy of radiomics algorithms and DL models in the diagnosis of carotid plaque.
Analysis of the Main Aspects
This meta-analysis demonstrates that radiomics-based models and DL models can diagnose extracranial carotid plaque, but the advantages of DL models in specificity and SROC should be interpreted with caution. A review of the included studies revealed that, among the 24 investigations using DL models, 20 primarily focused on plaque characterization (11 on the detection of plaques and 9 on plaque stability). Of these, 13 studies used ultrasound imaging to identify plaque-specific features such as echogenicity, morphology, and composition. In contrast, among the 10 studies using radiomics-based ML models, 6 were dedicated to identifying symptomatic plaques, predominantly using MRI (n=2) and CTA (n=3). The accuracy of symptomatic plaque identification was influenced not only by intrinsic imaging characteristics but also by clinical indicators, including plaque rupture, thrombus formation, and the occurrence of cerebral hypoperfusion. The tasks were more complex, and model training seemed to focus on reducing false negatives to lower the risk of adverse outcomes such as stroke. In addition, traditional ML algorithms may rely on manual preprocessing and struggle to capture other subtle differences (such as the presence of tiny thrombi or fibrous cap thickness), which may introduce variability and additional costs. In contrast, the DL models (particularly convolutional neural networks) do not rely on artificially designed features; instead, they can directly process raw medical images, automatically filter noise, and automatically extract more meaningful image features (eg, slight echo attenuation behind plaques, differences in vascular wall elasticity, etc) []. It can also analyze the preset artificial extraction features, conduct independent learning, and uncover potential rules, thereby addressing the aforementioned challenges [,]. It is worth noting that a mismatch in the number of studies may also affect the interpretation of the results. Therefore, these differences may not be simply due to model performance, but could also be caused by multiple factors, which need to be further investigated.
Besides, the “black box” nature of AI algorithms, particularly DL models, raises concerns about the transparency and reliability of decision-making. Of the 34 studies reviewed, only 2 used explainable DL models, achieving an accuracy of 98.2% [,]. The explainable AI (XAI) approach leverages visualization techniques, feature attribution analysis, and both global and local explanations to clarify how models derive predictions from input data. By enhancing transparency, XAI fosters greater trust among medical professionals, strengthens model reliability and accountability, and helps mitigate concerns related to opaque decision-making []. The integration of XAI in medicine not only represents a technological advancement but also ensures safe, efficient, and robust medical decision-making, which needs to be further investigated. To realize this potential, a clinically oriented XAI implementation framework needs to be developed. First, the reporting criteria for interpretable techniques (including clinical applicability evaluation and operational guidelines) should be standardized to lower the threshold for physician use. Second, the design of algorithms should be optimized through collaborative efforts of medical professionals and engineers to improve the specificity of feature attribution methods based on real clinical needs. Further clinical validation studies are needed to evaluate the practical utility of XAI across diverse diagnostic settings—such as varying regions, hospital levels, and clinician experience—and to determine its true value in supporting clinical decision-making beyond algorithmic performance []. Furthermore, incomplete disclosure of model development processes in reports, selective presentation of results by investigators, and heterogeneity in diagnostic standard implementation across practitioners with different levels of experience may decrease the reliability and generalizability of findings. Therefore, we recommend the formulation of standardized imaging protocols, reporting procedures, and quality control measures for carotid plaque assessment and advocate for the establishment of specialized AI reporting guidelines for cardiovascular diseases.
Advances in imaging technology have now largely met the diagnostic requirements of current clinical practice, and current guidelines place heavy reliance on imaging tests for carotid plaque assessment. Among the 34 included studies, 27 constructed diagnostic models based only on imaging data. However, this should not be interpreted as rendering other clinical parameters irrelevant. Multidimensional diagnostic models combined with clinical features have been shown to achieve good diagnostic performance in identifying various diseases, such as pancreatic ductal adenocarcinoma [], HCC recurrence after liver transplantation [], hemorrhagic brain metastases [], malignant BI-RADS 4 breast masses [], and others. In our study, the diagnostic performance of combined models did not slightly improve, which may be due to the small sample size or some features could not provide more diagnostic information (for example, Hu et al [] constructed a model relying only on indirect perivascular adipose tissue radiomic features and clinical features to identify symptomatic plaques, lacking direct imaging features). Considering this evidence, we strongly recommend that future research should aim to not only systematically incorporate laboratory tests, medical history, and other clinical parameters to develop multidimensional diagnostic models, but also to summarize the most meaningful features for specific types of plaques. This could address the limitations in current studies regarding single imaging modalities. This will also improve the precise classification of carotid plaques and personalized risk assessment.
This meta-analysis identified significant heterogeneity, while meta-regression and subgroup regression analysis did not identify the source, primarily attributable to the intrinsic challenges in regulating all potential confounding factors. Different imaging techniques can affect model performance based on the type of images used (static images vs dynamic videos), the equipment, and the operators. Guang et al [] used a contrast-enhanced ultrasound video-based DL model to evaluate the diagnostic efficacy of a new carotid network structure for assessing carotid plaques, whereas other ultrasound studies consistently used static images. The sequence of MRI scans also influences diagnostic outcomes. Zhang et al [] reported that a model incorporating a combination of T1-weighted, T2-weighted, dynamic contrast-enhanced, and postcontrast (POST) MRI sequences achieved a higher AUC for identifying high-risk carotid plaques compared to models using individual sequences or partial combinations. This enhanced performance is attributed to the complementary nature of these imaging sequences, each capturing distinct pathophysiological characteristics of the plaque, thereby improving diagnostic accuracy when used in combination. PRs have limited resolution, only detecting calcified components of carotid plaques and missing features such as lipid-rich necrotic cores or thin or ruptured fibrous caps. There are also notable differences in model architecture. Yoo et al [] found performance variations among different convolutional neural network architectures within the CACSNet framework on the same dataset. Gui et al [] compared multiple DL models (eg, 3D-DenseNet, 3D-SE-DenseNet) with 9 ML algorithms (including Decision Tree, Random Forest, SVM, etc) using identical datasets. They found that DL models generally performed better across key metrics like AUC and accuracy, with significant performance differences between and within the two model types. These suggest that scanning parameters, model architectures, image segmentation, and algorithms may explain the heterogeneity in the research results. However, the small number of studies limits our ability to perform comprehensive subgroup analyses, which need to be further investigated.
The use of AI has significantly promoted the diagnosis of carotid plaque; however, its application requires cautious evaluation. Only 9 studies were multicenter (most used external validation), with diagnostic performance lower than single-center studies. Most studies (n=29) had a high risk of bias due to a lack of open-source data and external validation and failure to present the rationale and breakdown of its sets, which led to overestimation of the research results and affected the reproducibility and generalizability of the findings. Similar issues have been noted in previous reports, highlighting a broader deficiency in rigorous research standards within the field [-]. Furthermore, the contingency tables mostly come from the testing sets. Although the testing set achieved the best diagnostic performance, it had higher data quality or similar data distribution to the training, or overfitting noise, resulting in inaccurate performance estimation, and strong regularization may also decrease its performance, ultimately undermining clinical confidence in these models.
This study has certain clinical significance. We conducted an in-depth literature review and methodological quality evaluation, presenting the most current and comprehensive systematic review of AI-based diagnostic approaches for assessing carotid plaque. The findings reveal that AI technology shows considerable potential for diagnosing carotid plaque, but the findings need to be further validated by conducting more rigorous external validation using large-scale, high-quality independent datasets.
Limitations
This study has several limitations. First, the heterogeneity in model architectures and validation methods across studies prevents definitive conclusions regarding the most effective AI approaches. Second, many studies lack multicenter external validation, leading to a high risk of bias. The model overfitting and clinical applicability need to be carefully evaluated. Third, meta-regression and subgroup analysis did not identify the sources of high heterogeneity that existed in most of the included studies. We hypothesize that this heterogeneity may be caused by scanning parameters, model architectures, image segmentation, and algorithms. However, the overly scattered distribution of subgroups due to the limited number of studies restricts more in-depth subgroup analyses. Finally, although the Deeks test did not show significant publication bias, the included studies may have intentionally unreported negative results and omitted potentially relevant non-English literature.
Future studies should use a more comprehensive analytical methodology based on the current model. Researchers should strictly follow regulatory norms and standardized operating procedures. Prospective and multicenter studies and additional external validation are warranted to enhance the robustness and generalizability of the existing models. In the future, researchers should perform independent systematic reviews on specific subtopics—such as imaging modalities, lesion types, or model architectures—to facilitate targeted evaluations of AI performance across distinct clinical scenarios. In addition, studies on imaging modalities such as CT and MRI are advocated to generate more data, conduct subgroup analyses, and clarify the optimal matching of modality, plaque type, and algorithm. Future efforts should focus on identifying more meaningful features and building and evaluating the diagnostic performance of multidimensional diagnostic models. In parallel, establishing clinically oriented, XAI frameworks will be essential for enhancing transparency.
Conclusions
Current findings indicate that radiomics algorithms and DL models can effectively diagnose extracranial carotid plaque. However, the irregularities in research design and the lack of multicenter studies and external validation limit the robustness of the present findings. Future research should aim to reduce bias risk and enhance the generalizability and clinical orientation of the models.
The manuscript was written without the use of ChatGPT or other generative language models.
The conduct of this study, the writing of the manuscript, and its publication did not receive any external financial support or grants from any public, commercial, or nonprofit entities.
The data that support the findings of this study are available from the corresponding author upon reasonable request.
Writing – review & editing: LJ (lead), RL (supporting), YW (supporting), SW (supporting), NM (supporting), JR (supporting)
None declared.
Edited by Andrew Coristine; submitted 07.May.2025; peer-reviewed by Mohammad Amin Ashoobi, Rodrigo Orozco, Zhe Fang; accepted 17.Nov.2025; published 22.Jan.2026.
This is an open-access article distributed under the terms of the Creative Commons Attribution License (https://creativecommons.org/licenses/by/4.0/), which permits unrestricted use, distribution, and reproduction in any medium, provided the original work, first published in the Journal of Medical Internet Research (ISSN 1438-8871), is properly cited. The complete bibliographic information, a link to the original publication on https://www.jmir.org/, as well as this copyright and license information must be included.